Categories &
Functions List
- BetaDistribution
- BinomialDistribution
- BirnbaumSaundersDistribution
- BurrDistribution
- ExponentialDistribution
- ExtremeValueDistribution
- GammaDistribution
- GeneralizedExtremeValueDistribution
- GeneralizedParetoDistribution
- HalfNormalDistribution
- InverseGaussianDistribution
- LogisticDistribution
- LoglogisticDistribution
- LognormalDistribution
- LoguniformDistribution
- MultinomialDistribution
- NakagamiDistribution
- NegativeBinomialDistribution
- NormalDistribution
- PiecewiseLinearDistribution
- PoissonDistribution
- RayleighDistribution
- RicianDistribution
- tLocationScaleDistribution
- TriangularDistribution
- UniformDistribution
- WeibullDistribution
- betafit
- betalike
- binofit
- binolike
- bisafit
- bisalike
- burrfit
- burrlike
- evfit
- evlike
- expfit
- explike
- gamfit
- gamlike
- geofit
- gevfit_lmom
- gevfit
- gevlike
- gpfit
- gplike
- gumbelfit
- gumbellike
- hnfit
- hnlike
- invgfit
- invglike
- logifit
- logilike
- loglfit
- logllike
- lognfit
- lognlike
- nakafit
- nakalike
- nbinfit
- nbinlike
- normfit
- normlike
- poissfit
- poisslike
- raylfit
- rayllike
- ricefit
- ricelike
- tlsfit
- tlslike
- unidfit
- unifit
- wblfit
- wbllike
- betacdf
- betainv
- betapdf
- betarnd
- binocdf
- binoinv
- binopdf
- binornd
- bisacdf
- bisainv
- bisapdf
- bisarnd
- burrcdf
- burrinv
- burrpdf
- burrrnd
- bvncdf
- bvtcdf
- cauchycdf
- cauchyinv
- cauchypdf
- cauchyrnd
- chi2cdf
- chi2inv
- chi2pdf
- chi2rnd
- copulacdf
- copulapdf
- copularnd
- evcdf
- evinv
- evpdf
- evrnd
- expcdf
- expinv
- exppdf
- exprnd
- fcdf
- finv
- fpdf
- frnd
- gamcdf
- gaminv
- gampdf
- gamrnd
- geocdf
- geoinv
- geopdf
- geornd
- gevcdf
- gevinv
- gevpdf
- gevrnd
- gpcdf
- gpinv
- gppdf
- gprnd
- gumbelcdf
- gumbelinv
- gumbelpdf
- gumbelrnd
- hncdf
- hninv
- hnpdf
- hnrnd
- hygecdf
- hygeinv
- hygepdf
- hygernd
- invgcdf
- invginv
- invgpdf
- invgrnd
- iwishpdf
- iwishrnd
- jsucdf
- jsupdf
- laplacecdf
- laplaceinv
- laplacepdf
- laplacernd
- logicdf
- logiinv
- logipdf
- logirnd
- loglcdf
- loglinv
- loglpdf
- loglrnd
- logncdf
- logninv
- lognpdf
- lognrnd
- mnpdf
- mnrnd
- mvncdf
- mvnpdf
- mvnrnd
- mvtcdf
- mvtpdf
- mvtrnd
- mvtcdfqmc
- nakacdf
- nakainv
- nakapdf
- nakarnd
- nbincdf
- nbininv
- nbinpdf
- nbinrnd
- ncfcdf
- ncfinv
- ncfpdf
- ncfrnd
- nctcdf
- nctinv
- nctpdf
- nctrnd
- ncx2cdf
- ncx2inv
- ncx2pdf
- ncx2rnd
- normcdf
- norminv
- normpdf
- normrnd
- plcdf
- plinv
- plpdf
- plrnd
- poisscdf
- poissinv
- poisspdf
- poissrnd
- raylcdf
- raylinv
- raylpdf
- raylrnd
- ricecdf
- riceinv
- ricepdf
- ricernd
- tcdf
- tinv
- tpdf
- trnd
- tlscdf
- tlsinv
- tlspdf
- tlsrnd
- tricdf
- triinv
- tripdf
- trirnd
- unidcdf
- unidinv
- unidpdf
- unidrnd
- unifcdf
- unifinv
- unifpdf
- unifrnd
- vmcdf
- vminv
- vmpdf
- vmrnd
- wblcdf
- wblinv
- wblpdf
- wblrnd
- wienrnd
- wishpdf
- wishrnd
- adtest
- anova
- anova1
- anova2
- anovan
- bartlett_test
- barttest
- binotest
- chi2gof
- chi2test
- correlation_test
- fishertest
- friedman
- hotelling_t2test
- hotelling_t2test2
- kruskalwallis
- kstest
- kstest2
- levene_test
- manova1
- mcnemar_test
- multcompare
- ranksum
- regression_ftest
- regression_ttest
- runstest
- sampsizepwr
- signrank
- signtest
- tiedrank
- ttest
- ttest2
- vartest
- vartest2
- vartestn
- ztest
- ztest2
Function Reference: isoutlier
statistics: TF = isoutlier (x)
statistics: TF = isoutlier (x, method)
statistics: TF = isoutlier (x,
'percentiles', threshold)statistics: TF = isoutlier (x, movmethod, window)
statistics: TF = isoutlier (…, dim)
statistics: TF = isoutlier (…, Name, Value)
statistics: [TF, L, U, C] = isoutlier (…)
Find outliers in data
isoutlier (x) returns a logical array whose elements are true
when an outlier is detected in the corresponding element of x.
isoutlier treats NaNs as missing values and removes them.
-
If x is a matrix, then
isoutlieroperates on each column of x separately. -
If x is a multidimensional array, then
isoutlieroperates along the first dimension of x whose size does not equal 1.
By default, an outlier is a value that is more than three scaled median
absolute deviations (MAD) from the median. The scaled median is defined as
c*median(abs(A-median(A))), where c=-1/(sqrt(2)*erfcinv(3/2)).
isoutlier (x, method) specifies a method for detecting
outliers. The following methods are available:
| Method | Description | |
|---|---|---|
'median' | Outliers are defined as elements more than three scaled MAD from the median. | |
'mean' | Outliers are defined as elements more than three standard deviations from the mean. | |
'quartiles' | Outliers are defined as elements more than 1.5 interquartile ranges above the upper quartile (75 percent) or below the lower quartile (25 percent). This method is useful when the data in x is not normally distributed. | |
'grubbs' | Outliers are detected using Grubbs’ test for outliers, which removes one outlier per iteration based on hypothesis testing. This method assumes that the data in x is normally distributed. | |
'gesd' | Outliers are detected using the generalized
extreme Studentized deviate test for outliers. This iterative method is
similar to 'grubbs', but can perform better when there are multiple
outliers masking each other. |
isoutlier (x, detects
outliers based on a percentile thresholds, specified as a two-element row
vector whose elements are in the interval . The first element
indicates the lower percentile threshold, and the second element indicates
the upper percentile threshold. The first element of threshold must be less
than the second element.
'percentiles', threshold)
isoutlier (x, movmethod, window) specifies a moving
method for detecting outliers. The following methods are available:
| Method | Description | |
|---|---|---|
'movmedian' | Outliers are defined as elements more than three local scaled MAD from the local median over a window length specified by window. | |
'movmean' | Outliers are defined as elements more than three local standard deviations from the from the local mean over a window length specified by window. |
window must be a positive integer scalar or a two-element vector of
positive integers. When window is a scalar, if it is an odd number,
the window is centered about the current element and contains
window - 1 neighboring elements. If even, then the window is
centered about the current and previous elements. When window is a
two-element vector of positive integers , the window contains
the current element, elements before the current element, and
elements after the current element. When 'SamplePoints'
are also specified, window can take any real positive values (either as
a scalar or a two-element vector) and in this case, the windows are computed
relative to the sample points.
dim specifies the operating dimension and it must be a positive integer
scalar. If not specified, then, by default, isoutlier operates along
the first non-singleton dimension of x.
The following optional parameters can be specified as Name/Value paired arguments.
-
'SamplePoints'can be specified as a vector of sample points with equal length as the operating dimension. The sample points represent the x-axis location of the data and must be sorted and contain unique elements. Sample points do not need to be uniformly sampled. By default, the vector is[1, 2, 3, …, n], wheren = size (x, dim). You can use unequally spaced'SamplePoints'to define a variable-length window for one of the moving methods available. -
'ThresholdFactor'can be specified as a nonnegative scalar. For methods'median'and'movmedian', the detection threshold factor replaces the number of scaled MAD, which is 3 by default. For methods'mean'and'movmean', the detection threshold factor replaces the number of standard deviations, which is 3 by default. For methods'grubbs'and'gesd', the detection threshold factor ranges from 0 to 1, specifying the critical -value of the respective test, and it is 0.05 by default. For the'quartiles'method, the detection threshold factor replaces the number of interquartile ranges, which is 1.5 by default.'ThresholdFactor'is not supported for the'quartiles'method. -
'MaxNumOutliers'is only relevant to the'gesd'method and it must be a positive integer scalar specifying the maximum number of outliers returned by the'gesd'method. By default, it is the integer nearest to the 10% of the number of elements along the operating dimension in x. The'gesd'method assumes the nonoutlier input data is sampled from an approximate normal distribution. When the data is not sampled in this way, the number of returned outliers might exceed theMaxNumOutliersvalue.
[TF, L, U, C] = isoutlier (…) returns
up to 4 output arguments as described below.
- TF is the outlier indicator with the same size a x.
- L is the lower threshold used by the outlier detection method. If method is used for outlier detection, then L has the same size as x in all dimensions except for the operating dimension where the length is 1. If movmethod is used, then L has the same size as x.
- U is the upper threshold used by the outlier detection method. If method is used for outlier detection, then U has the same size as x in all dimensions except for the operating dimension where the length is 1. If movmethod is used, then U has the same size as x.
- C is the center value used by the outlier detection method.
If method is used for outlier detection, then C has the same size
as x in all dimensions except for the operating dimension where the
length is 1. If movmethod is used, then C has the same size as
x. For
'median','movmedian','mean', and'movmean'methods, C is computed by taking into account the outlier values. For'grubbs'and'gesd'methods, C is computed by excluding the outliers. For the'percentiles'method, C is the average between U and L thresholds.
See also: filloutliers, rmoutliers, ismissing
Source Code: isoutlier
Example: 1
 A = [57 59 60 100 59 58 57 58 300 61 62 60 62 58 57];
 TF = isoutlier (A, 'mean')
TF =

  0  0  0  0  0  0  0  0  1  0  0  0  0  0  0
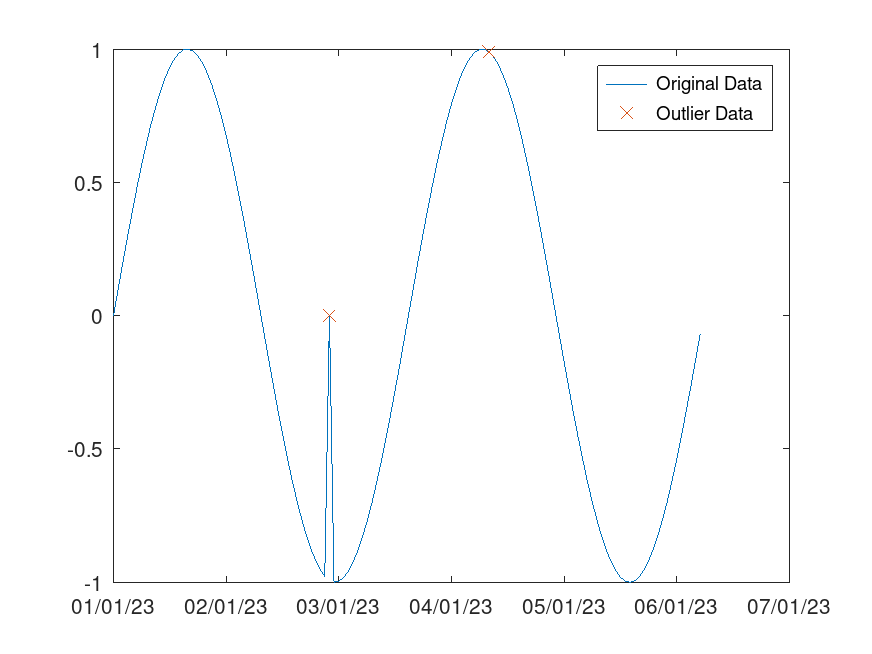
Example: 2
Use a moving detection method to detect local outliers in a sine wave
 x = -2*pi:0.1:2*pi;
 A = sin (x);
 A(47) = 0;
 time = datenum (2023,1,1,0,0,0) + (1/24)*[0:length(x)-1] - 730485;
 TF = isoutlier (A, 'movmedian', 5*(1/24), 'SamplePoints', time);
 plot (time, A)
 hold on
 plot (time(TF), A(TF), 'x')
 datetick ('x', 20, 'keepticks')
 legend ('Original Data', 'Outlier Data')
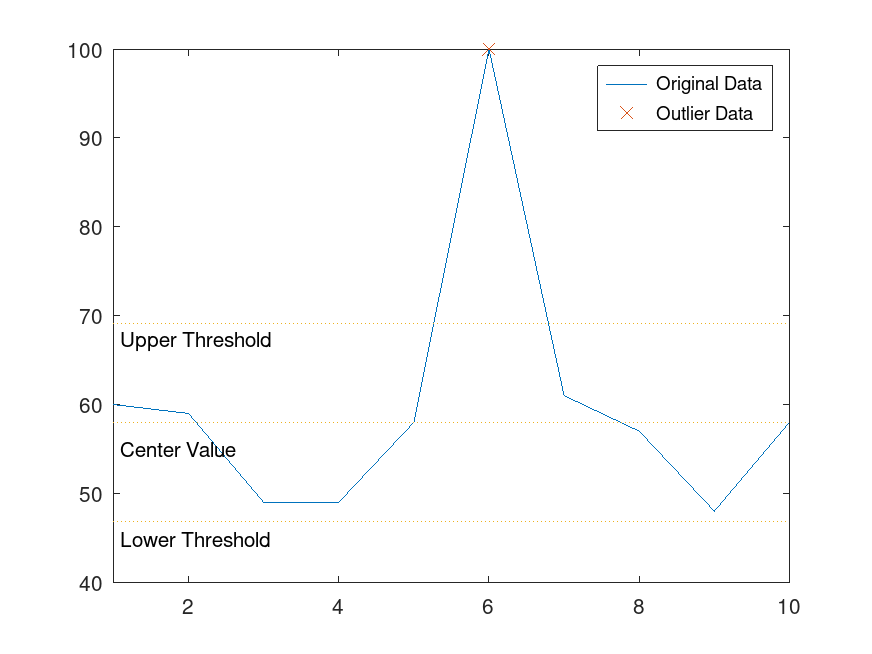
Example: 3
Locate an outlier in a vector of data and visualize the outlier
 x = 1:10;
 A = [60 59 49 49 58 100 61 57 48 58];
 [TF, L, U, C] = isoutlier (A);
 plot (x, A);
 hold on
 plot (x(TF), A(TF), 'x');
 xlim ([1,10]);
 line ([1,10], [L, L], 'Linestyle', ':');
 text (1.1, L-2, 'Lower Threshold');
 line ([1,10], [U, U], 'Linestyle', ':');
 text (1.1, U-2, 'Upper Threshold');
 line ([1,10], [C, C], 'Linestyle', ':');
 text (1.1, C-3, 'Center Value');
 legend ('Original Data', 'Outlier Data');