Categories &
Functions List
- BetaDistribution
- BinomialDistribution
- BirnbaumSaundersDistribution
- BurrDistribution
- ExponentialDistribution
- ExtremeValueDistribution
- GammaDistribution
- GeneralizedExtremeValueDistribution
- GeneralizedParetoDistribution
- HalfNormalDistribution
- InverseGaussianDistribution
- LogisticDistribution
- LoglogisticDistribution
- LognormalDistribution
- LoguniformDistribution
- MultinomialDistribution
- NakagamiDistribution
- NegativeBinomialDistribution
- NormalDistribution
- PiecewiseLinearDistribution
- PoissonDistribution
- RayleighDistribution
- RicianDistribution
- tLocationScaleDistribution
- TriangularDistribution
- UniformDistribution
- WeibullDistribution
- betafit
- betalike
- binofit
- binolike
- bisafit
- bisalike
- burrfit
- burrlike
- evfit
- evlike
- expfit
- explike
- gamfit
- gamlike
- geofit
- gevfit_lmom
- gevfit
- gevlike
- gpfit
- gplike
- gumbelfit
- gumbellike
- hnfit
- hnlike
- invgfit
- invglike
- logifit
- logilike
- loglfit
- logllike
- lognfit
- lognlike
- nakafit
- nakalike
- nbinfit
- nbinlike
- normfit
- normlike
- poissfit
- poisslike
- raylfit
- rayllike
- ricefit
- ricelike
- tlsfit
- tlslike
- unidfit
- unifit
- wblfit
- wbllike
- betacdf
- betainv
- betapdf
- betarnd
- binocdf
- binoinv
- binopdf
- binornd
- bisacdf
- bisainv
- bisapdf
- bisarnd
- burrcdf
- burrinv
- burrpdf
- burrrnd
- bvncdf
- bvtcdf
- cauchycdf
- cauchyinv
- cauchypdf
- cauchyrnd
- chi2cdf
- chi2inv
- chi2pdf
- chi2rnd
- copulacdf
- copulapdf
- copularnd
- evcdf
- evinv
- evpdf
- evrnd
- expcdf
- expinv
- exppdf
- exprnd
- fcdf
- finv
- fpdf
- frnd
- gamcdf
- gaminv
- gampdf
- gamrnd
- geocdf
- geoinv
- geopdf
- geornd
- gevcdf
- gevinv
- gevpdf
- gevrnd
- gpcdf
- gpinv
- gppdf
- gprnd
- gumbelcdf
- gumbelinv
- gumbelpdf
- gumbelrnd
- hncdf
- hninv
- hnpdf
- hnrnd
- hygecdf
- hygeinv
- hygepdf
- hygernd
- invgcdf
- invginv
- invgpdf
- invgrnd
- iwishpdf
- iwishrnd
- jsucdf
- jsupdf
- laplacecdf
- laplaceinv
- laplacepdf
- laplacernd
- logicdf
- logiinv
- logipdf
- logirnd
- loglcdf
- loglinv
- loglpdf
- loglrnd
- logncdf
- logninv
- lognpdf
- lognrnd
- mnpdf
- mnrnd
- mvncdf
- mvnpdf
- mvnrnd
- mvtcdf
- mvtpdf
- mvtrnd
- mvtcdfqmc
- nakacdf
- nakainv
- nakapdf
- nakarnd
- nbincdf
- nbininv
- nbinpdf
- nbinrnd
- ncfcdf
- ncfinv
- ncfpdf
- ncfrnd
- nctcdf
- nctinv
- nctpdf
- nctrnd
- ncx2cdf
- ncx2inv
- ncx2pdf
- ncx2rnd
- normcdf
- norminv
- normpdf
- normrnd
- plcdf
- plinv
- plpdf
- plrnd
- poisscdf
- poissinv
- poisspdf
- poissrnd
- raylcdf
- raylinv
- raylpdf
- raylrnd
- ricecdf
- riceinv
- ricepdf
- ricernd
- tcdf
- tinv
- tpdf
- trnd
- tlscdf
- tlsinv
- tlspdf
- tlsrnd
- tricdf
- triinv
- tripdf
- trirnd
- unidcdf
- unidinv
- unidpdf
- unidrnd
- unifcdf
- unifinv
- unifpdf
- unifrnd
- vmcdf
- vminv
- vmpdf
- vmrnd
- wblcdf
- wblinv
- wblpdf
- wblrnd
- wienrnd
- wishpdf
- wishrnd
- adtest
- anova
- anova1
- anova2
- anovan
- bartlett_test
- barttest
- binotest
- chi2gof
- chi2test
- correlation_test
- fishertest
- friedman
- hotelling_t2test
- hotelling_t2test2
- kruskalwallis
- kstest
- kstest2
- levene_test
- manova1
- mcnemar_test
- multcompare
- ranksum
- regression_ftest
- regression_ttest
- runstest
- sampsizepwr
- signrank
- signtest
- tiedrank
- ttest
- ttest2
- vartest
- vartest2
- vartestn
- ztest
- ztest2
Function Reference: vartestn
statistics: vartestn (x)
statistics: vartestn (x, group)
statistics: vartestn (…, name, value)
statistics: p = vartestn (…)
statistics: [p, stats] = vartestn (…)
statistics: [p, stats] = vartestn (…, name, value)
Test for equal variances across multiple groups.
h = vartestn (x) performs Bartlett’s test for equal
variances for the columns of the matrix x. This is a test of the null
hypothesis that the columns of x come from normal distributions with
the same variance, against the alternative that they come from normal
distributions with different variances. The result is displayed in a summary
table of statistics as well as a box plot of the groups.
vartestn (x, group) requires a vector x, and a
group argument that is a categorical variable, vector, string array, or
cell array of strings with one row for each element of x. Values of
x corresponding to the same value of group are placed in the same
group.
vartestn treats NaNs as missing values, and ignores them.
p = vartestn (…) returns the probability of observing the
given result, or one more extreme, by chance under the null hypothesis that
all groups have equal variances. Small values of p cast doubt on the
validity of the null hypothesis.
[p, stats] = vartestn (…) returns a structure with
the following fields:
chistat | – the value of the test statistic | |
df | – the degrees of freedom of the test |
[p, stats] = vartestn (…, name, value)
specifies one or more of the following name/value pairs:
'display' | 'on' to display a boxplot and table, or
'off' to omit these displays. Default 'on'. |
'testtype' | One of the following strings to control the type of test to perform |
'Bartlett' | Bartlett’s test (default). | |
'LeveneQuadratic' | Levene’s test computed by performing anova on the squared deviations of the data values from their group means. | |
'LeveneAbsolute' | Levene’s test computed by performing anova on the absolute deviations of the data values from their group means. | |
'BrownForsythe' | Brown-Forsythe test computed by performing anova on the absolute deviations of the data values from the group medians. | |
'OBrien' | O’Brien’s modification of Levene’s test with . |
The classical Bartlett’s test is sensitive to the assumption that the
distribution in each group is normal. The other test types are more robust
to non-normal distributions, especially ones prone to outliers. For these
tests, the STATS output structure has a field named fstat containing
the test statistic, and df1 and df2 containing its numerator
and denominator degrees of freedom.
See also: vartest, vartest2, anova1, bartlett_test, levene_test
Source Code: vartestn
Example: 1
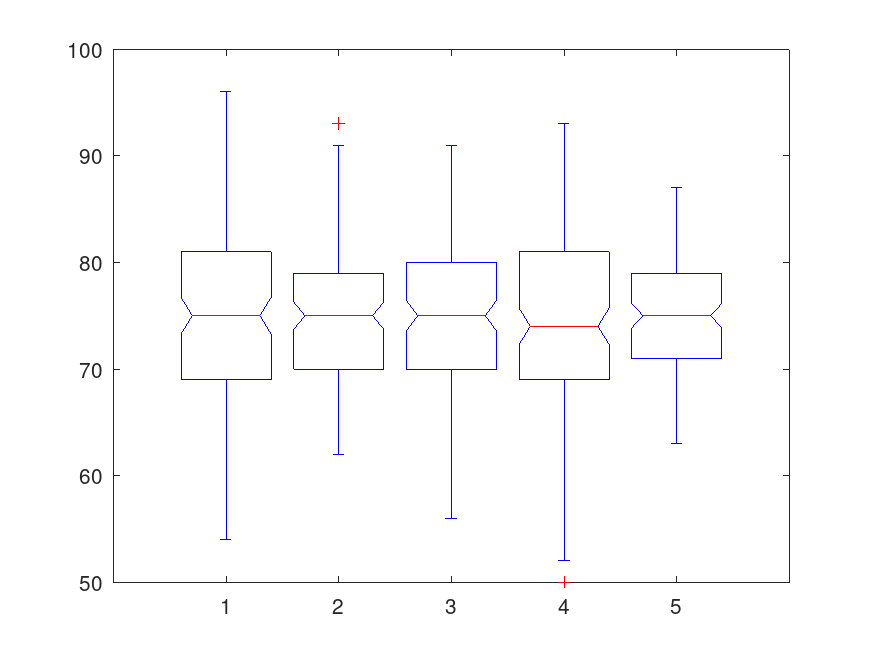
Test the null hypothesis that the variances are equal across the five columns of data in the students’ exam grades matrix, grades.
 load examgrades
 vartestn (grades)
                    Group Summary Table

Group                        Count        Mean       Std Dev
------------------------------------------------------------
1                            120        75.0083     8.720203
2                            120        74.9917     6.542037
3                            120        74.9917     7.430910
4                            120        75.0333     8.601283
5                            120        74.9917     5.258839
Pooled Groups                600        75.0033     7.310655
Pooled valid Groups          600        75.0083     8.720203

Bartlett's statistic             38.73324
Degrees of Freedom               4
p-value                          0.000000

ans = 7.9086e-08
Example: 2
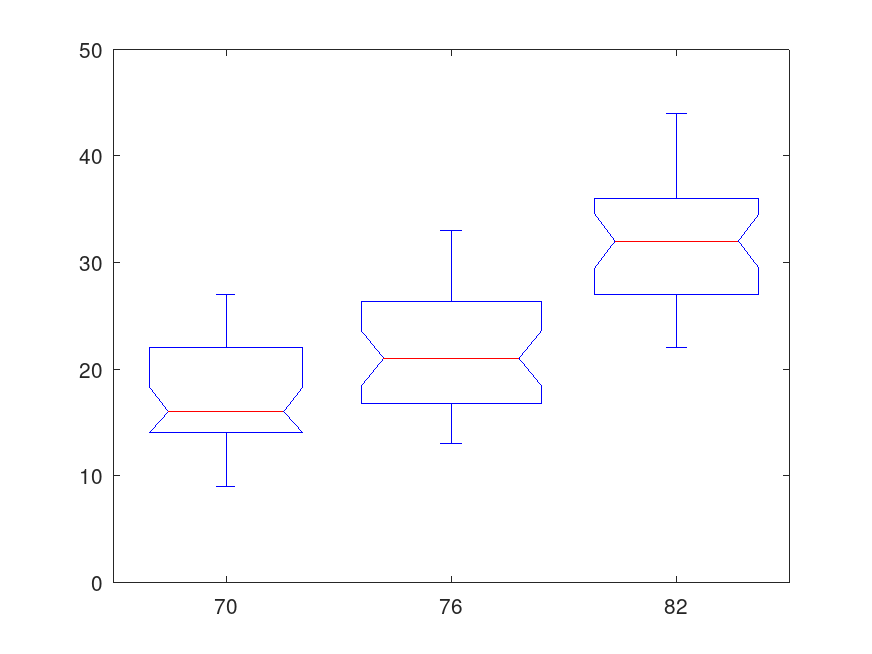
Test the null hypothesis that the variances in miles per gallon (MPG) are equal across different model years.
 load carsmall
 vartestn (MPG, Model_Year)
                    Group Summary Table

Group                        Count        Mean       Std Dev
------------------------------------------------------------
70                            29        17.6897     5.339231
76                            34        21.5735     5.889297
82                            31        31.7097     5.392548
Pooled Groups                 94        23.6576     5.540359
Pooled valid Groups           87        17.6897     5.339231

Bartlett's statistic             0.36619
Degrees of Freedom               2
p-value                          0.832687

ans = 0.8327

Example: 3
Use Levene’s test to test the null hypothesis that the variances in miles per gallon (MPG) are equal across different model years.
 load carsmall
 p = vartestn (MPG, Model_Year, 'TestType', 'LeveneAbsolute')
                    Group Summary Table

Group                        Count        Mean       Std Dev
------------------------------------------------------------
70                            29        17.6897     5.339231
76                            34        21.5735     5.889297
82                            31        31.7097     5.392548
Pooled Groups                 94        23.6576     5.540359
Pooled valid Groups         2958        23.7181     5.555774

Levene's statistic (absolute)    0.46126
Degrees of Freedom               2,  91
p-value                          0.631954

p = 0.6320
Example: 4
Test the null hypothesis that the variances are equal across the five columns of data in the students’ exam grades matrix, grades, using the Brown-Forsythe test. Suppress the display of the summary table of statistics and the box plot.
 load examgrades
 [p, stats] = vartestn (grades, 'TestType', 'BrownForsythe', 'Display', 'off')
p = 1.3121e-06
stats =

  scalar structure containing the fields:

    fstat = 8.4160
    df =

         4   595