Categories &
Functions List
- BetaDistribution
- BinomialDistribution
- BirnbaumSaundersDistribution
- BurrDistribution
- ExponentialDistribution
- ExtremeValueDistribution
- GammaDistribution
- GeneralizedExtremeValueDistribution
- GeneralizedParetoDistribution
- HalfNormalDistribution
- InverseGaussianDistribution
- LogisticDistribution
- LoglogisticDistribution
- LognormalDistribution
- LoguniformDistribution
- MultinomialDistribution
- NakagamiDistribution
- NegativeBinomialDistribution
- NormalDistribution
- PiecewiseLinearDistribution
- PoissonDistribution
- RayleighDistribution
- RicianDistribution
- tLocationScaleDistribution
- TriangularDistribution
- UniformDistribution
- WeibullDistribution
- betafit
- betalike
- binofit
- binolike
- bisafit
- bisalike
- burrfit
- burrlike
- evfit
- evlike
- expfit
- explike
- gamfit
- gamlike
- geofit
- gevfit_lmom
- gevfit
- gevlike
- gpfit
- gplike
- gumbelfit
- gumbellike
- hnfit
- hnlike
- invgfit
- invglike
- logifit
- logilike
- loglfit
- logllike
- lognfit
- lognlike
- nakafit
- nakalike
- nbinfit
- nbinlike
- normfit
- normlike
- poissfit
- poisslike
- raylfit
- rayllike
- ricefit
- ricelike
- tlsfit
- tlslike
- unidfit
- unifit
- wblfit
- wbllike
- betacdf
- betainv
- betapdf
- betarnd
- binocdf
- binoinv
- binopdf
- binornd
- bisacdf
- bisainv
- bisapdf
- bisarnd
- burrcdf
- burrinv
- burrpdf
- burrrnd
- bvncdf
- bvtcdf
- cauchycdf
- cauchyinv
- cauchypdf
- cauchyrnd
- chi2cdf
- chi2inv
- chi2pdf
- chi2rnd
- copulacdf
- copulapdf
- copularnd
- evcdf
- evinv
- evpdf
- evrnd
- expcdf
- expinv
- exppdf
- exprnd
- fcdf
- finv
- fpdf
- frnd
- gamcdf
- gaminv
- gampdf
- gamrnd
- geocdf
- geoinv
- geopdf
- geornd
- gevcdf
- gevinv
- gevpdf
- gevrnd
- gpcdf
- gpinv
- gppdf
- gprnd
- gumbelcdf
- gumbelinv
- gumbelpdf
- gumbelrnd
- hncdf
- hninv
- hnpdf
- hnrnd
- hygecdf
- hygeinv
- hygepdf
- hygernd
- invgcdf
- invginv
- invgpdf
- invgrnd
- iwishpdf
- iwishrnd
- jsucdf
- jsupdf
- laplacecdf
- laplaceinv
- laplacepdf
- laplacernd
- logicdf
- logiinv
- logipdf
- logirnd
- loglcdf
- loglinv
- loglpdf
- loglrnd
- logncdf
- logninv
- lognpdf
- lognrnd
- mnpdf
- mnrnd
- mvncdf
- mvnpdf
- mvnrnd
- mvtcdf
- mvtpdf
- mvtrnd
- mvtcdfqmc
- nakacdf
- nakainv
- nakapdf
- nakarnd
- nbincdf
- nbininv
- nbinpdf
- nbinrnd
- ncfcdf
- ncfinv
- ncfpdf
- ncfrnd
- nctcdf
- nctinv
- nctpdf
- nctrnd
- ncx2cdf
- ncx2inv
- ncx2pdf
- ncx2rnd
- normcdf
- norminv
- normpdf
- normrnd
- plcdf
- plinv
- plpdf
- plrnd
- poisscdf
- poissinv
- poisspdf
- poissrnd
- raylcdf
- raylinv
- raylpdf
- raylrnd
- ricecdf
- riceinv
- ricepdf
- ricernd
- tcdf
- tinv
- tpdf
- trnd
- tlscdf
- tlsinv
- tlspdf
- tlsrnd
- tricdf
- triinv
- tripdf
- trirnd
- unidcdf
- unidinv
- unidpdf
- unidrnd
- unifcdf
- unifinv
- unifpdf
- unifrnd
- vmcdf
- vminv
- vmpdf
- vmrnd
- wblcdf
- wblinv
- wblpdf
- wblrnd
- wienrnd
- wishpdf
- wishrnd
- adtest
- anova
- anova1
- anova2
- anovan
- bartlett_test
- barttest
- binotest
- chi2gof
- chi2test
- correlation_test
- fishertest
- friedman
- hotelling_t2test
- hotelling_t2test2
- kruskalwallis
- kstest
- kstest2
- levene_test
- manova1
- mcnemar_test
- multcompare
- ranksum
- regression_ftest
- regression_ttest
- runstest
- sampsizepwr
- signrank
- signtest
- tiedrank
- ttest
- ttest2
- vartest
- vartest2
- vartestn
- ztest
- ztest2
Function Reference: plsregress
statistics: [xload, yload] = plsregress (X, Y)
statistics: [xload, yload] = plsregress (X, Y, NCOMP)
statistics: [xload, yload, xscore, yscore, coef, pctVar, mse, stats] = plsregress (X, Y, NCOMP)
statistics: [xload, yload, xscore, yscore, coef, pctVar, mse, stats] = plsregress (…, Name, Value)
Calculate partial least squares regression using SIMPLS algorithm.
plsregress uses the SIMPLS algorithm, and first centers X and
Y by subtracting off column means to get centered variables. However,
it does not rescale the columns. To perform partial least squares regression
with standardized variables, use zscore to normalize X and
Y.
[xload, yload] = plsregress (X, Y) computes a
partial least squares regression of Y on X, using NCOMP
PLS components, which by default are calculated as
min (size (X, 1) - 1, size(X, 2)), and returns the
the predictor and response loadings in xload and yload,
respectively.
- X is an matrix of predictor variables, with rows corresponding to observations, and columns corresponding to variables.
- Y is an response matrix.
- xload is a matrix of predictor loadings, where each row of xload contains coefficients that define a linear combination of PLS components that approximate the original predictor variables.
- yload is an matrix of response loadings, where each row of yload contains coefficients that define a linear combination of PLS components that approximate the original response variables.
[xload, yload] = plsregress (X, Y,
 NCOMP)
defines the desired number of PLS components to use in the
regression. NCOMP, a scalar positive integer, must not exceed the
default calculated value.
[xload, yload, xscore, yscore, coef,
 pctVar, mse, stats] = plsregress (X, Y,
 NCOMP)
also returns the following arguments:
- xscore is an orthonormal matrix with the predictor scores, i.e., the PLS components that are linear combinations of the variables in X, with rows corresponding to observations and columns corresponding to components.
- yscore is an orthonormal matrix with the response scores, i.e., the linear combinations of the responses with which the PLS components xscore have maximum covariance, with rows corresponding to observations and columns corresponding to components.
- coef is a matrix with the PLS regression coefficients, containing the intercepts in the first row.
- pctVar is a matrix containing the percentage of the variance explained by the model with the first row containing the percentage of explained varianced in X by each PLS component and the second row containing the percentage of explained variance in Y.
- mse is a matrix containing the estimated mean
squared errors for PLS models with
0:NCOMPcomponents with the first row containing the squared errors for the predictor variables in X and the second row containing the mean squared errors for the response variable(s) in Y. - stats is a structure with the following fields:
- stats
.Wis a matrix of PLS weights. - stats
.T2is the statistics for each point in xscore. - stats
.Xresidualsis an matrix with the predictor residuals. - stats
.Yresidualsis an matrix with the response residuals.
- stats
[…] = plsregress (…, Name, Value, …)
specifies one or more of the following Name/Value pairs:
| Name | Value | |
|---|---|---|
'CV' | The method used to compute mse. When
Value is a positive integer , plsregress uses
-fold cross-validation. Set Value to a cross-validation
partition, created using cvpartition, to use other forms of
cross-validation. Set Value to 'resubstitution' to use both
X and Y to fit the model and to estimate the mean squared errors,
without cross-validation. By default, Value = "resubstitution". | |
'MCReps' | A positive integer indicating the number of
Monte-Carlo repetitions for cross-validation. By default,
Value = 1. A different 'MCReps' value is only
meaningful when using the 'HoldOut' method for cross-validation,
previously set by a cvpartition object. If no cross-validation method
is used, then 'MCReps' must be 1. |
Further information about the PLS regression can be found at https://en.wikipedia.org/wiki/Partial_least_squares_regression
References
- SIMPLS: An alternative approach to partial least squares regression. Chemometrics and Intelligent Laboratory Systems (1993)
Source Code: plsregress
Example: 1
Perform Partial Least-Squares Regression
Load the spectra data set and use the near infrared (NIR) spectral intensities (NIR) as the predictor and the corresponding octave ratings (octave) as the response.
load spectra
Perform PLS regression with 10 components
[xload, yload, xscore, yscore, coef, ptcVar] = plsregress (NIR, octane, 10);
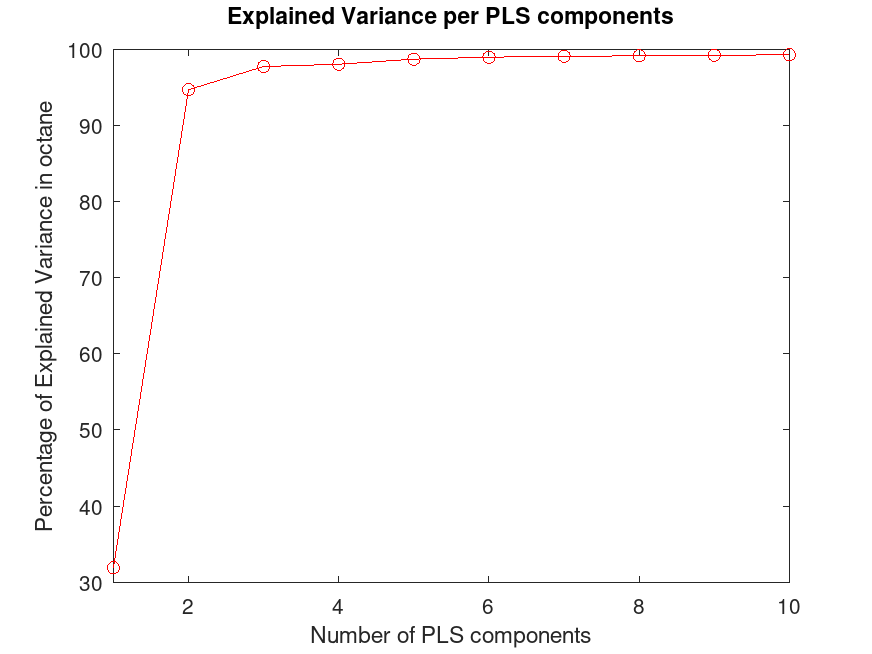
Plot the percentage of explained variance in the response variable (PCTVAR) as a function of the number of components.
 plot (1:10, cumsum (100 * ptcVar(2,:)), '-ro');
 xlim ([1, 10]);
 xlabel ('Number of PLS components');
 ylabel ('Percentage of Explained Variance in octane');
 title ('Explained Variance per PLS components');
Compute the fitted response and display the residuals.
 octane_fitted = [ones(size(NIR,1),1), NIR] * coef;
 residuals = octane - octane_fitted;
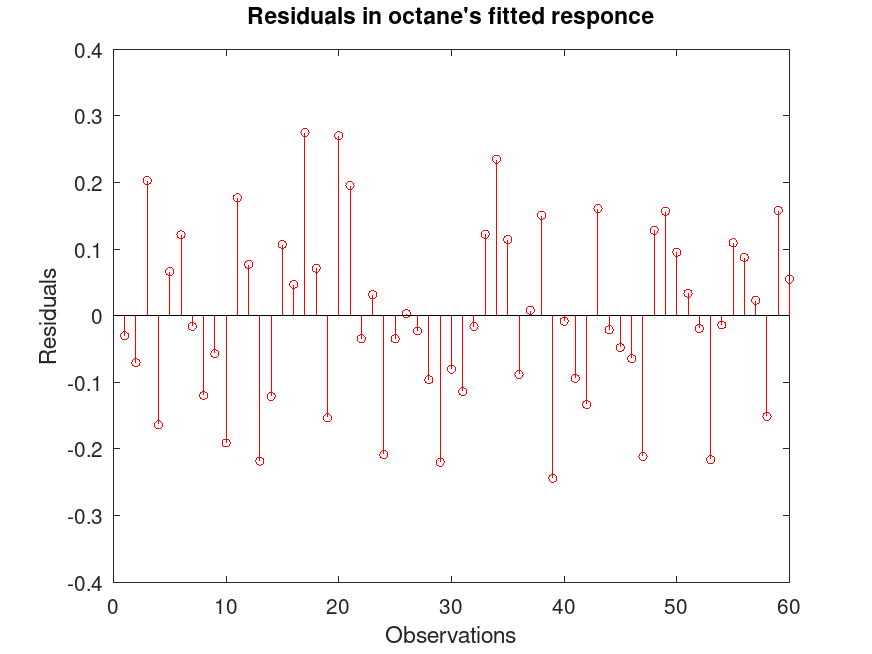
 figure
 stem (residuals, 'color', 'r', 'markersize', 4, 'markeredgecolor', 'r')
 xlabel ('Observations');
 ylabel ('Residuals');
 title ('Residuals in octane''s fitted response');
Example: 2
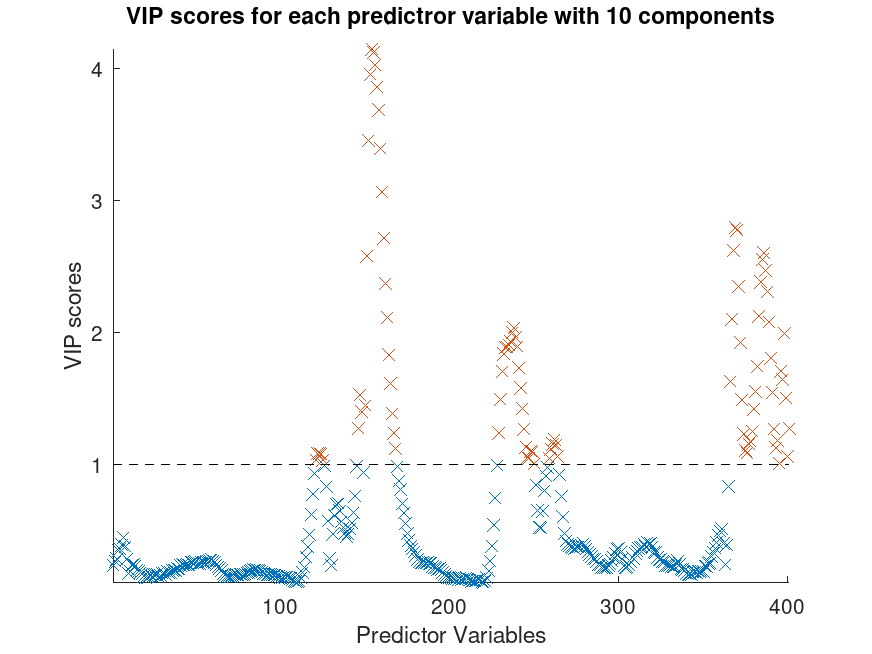
Calculate Variable Importance in Projection (VIP) for PLS Regression
Load the spectra data set and use the near infrared (NIR) spectral intensities (NIR) as the predictor and the corresponding octave ratings (octave) as the response. Variables with a VIP score greater than 1 are considered important for the projection of the PLS regression model.
load spectra
Perform PLS regression with 10 components
 [xload, yload, xscore, yscore, coef, pctVar, mse, stats] = ...
                                                 plsregress (NIR, octane, 10);
Calculate the normalized PLS weights
W0 = stats.W ./ sqrt (sum (stats.W.^2,1));
Calculate the VIP scores for 10 components
 nobs = size (xload, 1);
 SS = sum (xscore .^ 2, 1) .* sum (yload .^ 2, 1);
 VIPscore = sqrt (nobs * sum (SS .* (W0 .^ 2), 2) ./ sum (SS, 2));
Find variables with a VIP score greater than or equal to 1
VIPidx = find (VIPscore >= 1);
Plot the VIP scores
 scatter (1:length (VIPscore), VIPscore, 'xb');
 hold on
 scatter (VIPidx, VIPscore(VIPidx), 'xr');
 plot ([1, length(VIPscore)], [1, 1], '--k');
 hold off
 axis ('tight');
 xlabel ('Predictor Variables');
 ylabel ('VIP scores');
 title ('VIP scores for each predictor variable with 10 components');