Categories &
Functions List
- adtest
- anova
- anova1
- anova2
- anovan
- ansaribradley
- barttest
- binotest
- chi2gof
- chi2test
- correlation_test
- detectdrift
- dwtest
- fishertest
- friedman
- hotelling_t2test
- hotelling_t2test2
- jbtest
- knntest
- kruskalwallis
- kstest
- kstest2
- lillietest
- manova1
- mcnemar_test
- meanEffectSize
- mmdtest
- multcompare
- ranksum
- regression_ftest
- regression_ttest
- runstest
- signrank
- signtest
- stats.drift.DriftDiagnostics
- swtest
- ttest
- ttest2
- vartest
- vartest2
- vartestn
- ztest
- ztest2
- CompactLinearModel
- CoxModel
- coxphfit
- fitcox
- fitglm
- fitglme
- fitlm
- fitlme
- fitlmematrix
- fitnlm
- fitrm
- GeneralizedLinearMixedModel
- GeneralizedLinearModel
- glmfit
- glmval
- invpred
- lasso
- lassoglm
- LinearFormula
- LinearMixedModel
- LinearModel
- logistic_regression
- mnrfit
- mnrval
- monotone_smooth
- mvregress
- mvregresslike
- nlinfit
- nlparci
- nlpredci
- NonLinearModel
- plsregress
- regress
- regress_gp
- RepeatedMeasuresModel
- ridge
- robustfit
- stepwisefit
- stepwiseglm
- stepwiselm
- ClassificationBaggedEnsemble
- ClassificationDiscriminant
- ClassificationECOC
- ClassificationEnsemble
- ClassificationGAM
- ClassificationKernel
- ClassificationKNN
- ClassificationLinear
- ClassificationNaiveBayes
- ClassificationNeuralNetwork
- ClassificationPartitionedECOC
- ClassificationPartitionedEnsemble
- ClassificationPartitionedKernel
- ClassificationPartitionedLinear
- ClassificationPartitionedModel
- ClassificationSVM
- ClassificationTree
- CompactClassificationDiscriminant
- CompactClassificationECOC
- CompactClassificationEnsemble
- CompactClassificationGAM
- CompactClassificationNaiveBayes
- CompactClassificationNeuralNetwork
- CompactClassificationSVM
- CompactClassificationTree
- CompactRegressionGAM
- CompactRegressionEnsemble
- CompactRegressionGP
- CompactRegressionNeuralNetwork
- CompactRegressionSVM
- CompactRegressionTree
- CompactTreeBagger
- designecoc
- fcnnpredict
- fcnntrain
- fitcdiscr
- fitcecoc
- fitcensemble
- fitcgam
- fitckernel
- fitcknn
- fitclinear
- fitcnb
- fitcnet
- fitcsvm
- fitctree
- fitrensemble
- fitrgam
- fitrgp
- fitrkernel
- fitrlinear
- fitrnet
- fitrsvm
- fitrtree
- gamboostinter
- gamboostpairs
- gamboostpredict
- gamboosttrain
- gampredict
- gamtrain
- partialDependence
- plotPartialDependence
- PredictiveModel
- RegressionBaggedEnsemble
- RegressionEnsemble
- RegressionGAM
- RegressionGP
- RegressionKernel
- RegressionLinear
- RegressionNeuralNetwork
- RegressionPartitionedEnsemble
- RegressionPartitionedKernel
- RegressionPartitionedLinear
- RegressionPartitionedModel
- RegressionSVM
- RegressionTree
- lime
- shapley
- svmpredict
- svmtrain
- templateDiscriminant
- templateEnsemble
- templateKernel
- templateKNN
- templateLinear
- templateNaiveBayes
- templateSVM
- templateTree
- TreeBagger
- treepredict
- treetrain
- paretotails
- prob.ProbabilityDistribution
- prob.BetaDistribution
- prob.BinomialDistribution
- prob.BirnbaumSaundersDistribution
- prob.BurrDistribution
- prob.ExponentialDistribution
- prob.ExtremeValueDistribution
- prob.GammaDistribution
- prob.GeneralizedExtremeValueDistribution
- prob.GeneralizedParetoDistribution
- prob.HalfNormalDistribution
- prob.InverseGaussianDistribution
- prob.KernelDistribution
- prob.LogisticDistribution
- prob.LoglogisticDistribution
- prob.LognormalDistribution
- prob.LoguniformDistribution
- prob.MultinomialDistribution
- prob.NakagamiDistribution
- prob.NegativeBinomialDistribution
- prob.NormalDistribution
- prob.PiecewiseLinearDistribution
- prob.PoissonDistribution
- prob.RayleighDistribution
- prob.RicianDistribution
- prob.StableDistribution
- prob.tLocationScaleDistribution
- prob.TriangularDistribution
- prob.UniformDistribution
- prob.WeibullDistribution
- betafit
- betalike
- binofit
- binolike
- bisafit
- bisalike
- burrfit
- burrlike
- copulafit
- evfit
- evlike
- expfit
- explike
- gamfit
- gamlike
- geofit
- gevfit
- gevlike
- gevfit_lmom
- gpfit
- gplike
- gumbelfit
- gumbellike
- hnfit
- hnlike
- invgfit
- invglike
- logifit
- logilike
- loglfit
- logllike
- lognfit
- lognlike
- nakafit
- nakalike
- nbinfit
- nbinlike
- normfit
- normlike
- poissfit
- poisslike
- raylfit
- rayllike
- ricefit
- ricelike
- stblfit
- stbllike
- tlsfit
- tlslike
- unidfit
- unifit
- wblfit
- wbllike
- betacdf
- betainv
- betapdf
- betarnd
- binocdf
- binoinv
- binopdf
- binornd
- bisacdf
- bisainv
- bisapdf
- bisarnd
- burrcdf
- burrinv
- burrpdf
- burrrnd
- bvncdf
- bvtcdf
- cauchycdf
- cauchyinv
- cauchypdf
- cauchyrnd
- chi2cdf
- chi2inv
- chi2pdf
- chi2rnd
- copulacdf
- copulapdf
- copularnd
- evcdf
- evinv
- evpdf
- evrnd
- expcdf
- expinv
- exppdf
- exprnd
- fcdf
- finv
- fpdf
- frnd
- gamcdf
- gaminv
- gampdf
- gamrnd
- geocdf
- geoinv
- geopdf
- geornd
- gevcdf
- gevinv
- gevpdf
- gevrnd
- gpcdf
- gpinv
- gppdf
- gprnd
- gumbelcdf
- gumbelinv
- gumbelpdf
- gumbelrnd
- hncdf
- hninv
- hnpdf
- hnrnd
- hygecdf
- hygeinv
- hygepdf
- hygernd
- invgcdf
- invginv
- invgpdf
- invgrnd
- iwishpdf
- iwishrnd
- jsucdf
- jsupdf
- laplacecdf
- laplaceinv
- laplacepdf
- laplacernd
- logicdf
- logiinv
- logipdf
- logirnd
- loglcdf
- loglinv
- loglpdf
- loglrnd
- logncdf
- logninv
- lognpdf
- lognrnd
- mnpdf
- mnrnd
- mvncdf
- mvnpdf
- mvnrnd
- mvtcdf
- mvtpdf
- mvtrnd
- nakacdf
- nakainv
- nakapdf
- nakarnd
- nbincdf
- nbininv
- nbinpdf
- nbinrnd
- ncfcdf
- ncfinv
- ncfpdf
- ncfrnd
- nctcdf
- nctinv
- nctpdf
- nctrnd
- ncx2cdf
- ncx2inv
- ncx2pdf
- ncx2rnd
- normcdf
- norminv
- normpdf
- normrnd
- plcdf
- plinv
- plpdf
- plrnd
- poisscdf
- poissinv
- poisspdf
- poissrnd
- raylcdf
- raylinv
- raylpdf
- raylrnd
- ricecdf
- riceinv
- ricepdf
- ricernd
- stblcdf
- stblinv
- stblpdf
- stblrnd
- stdrcdf
- stdrinv
- stdrpdf
- stdrrnd
- tcdf
- tinv
- tpdf
- trnd
- tlscdf
- tlsinv
- tlspdf
- tlsrnd
- tricdf
- triinv
- tripdf
- trirnd
- unidcdf
- unidinv
- unidpdf
- unidrnd
- unifcdf
- unifinv
- unifpdf
- unifrnd
- vmcdf
- vminv
- vmpdf
- vmrnd
- wblcdf
- wblinv
- wblpdf
- wblrnd
- wienrnd
- wishpdf
- wishrnd
- betastat
- binostat
- bisastat
- burrstat
- chi2stat
- copulaparam
- copulastat
- evstat
- expstat
- fstat
- gamstat
- geostat
- gevstat
- gpstat
- gumbelstat
- hnstat
- hygestat
- invgstat
- logistat
- loglstat
- lognstat
- nakastat
- nbinstat
- ncfstat
- nctstat
- ncx2stat
- normstat
- plstat
- poisstat
- raylstat
- ricestat
- stdrstat
- tlsstat
- tristat
- tstat
- unidstat
- unifstat
- wblstat
- andrewsplot
- bar3
- bar3h
- biplot
- boxchart
- boxplot
- cdfplot
- dendrogram
- ecdfhist
- einstein
- gardnerAltmanPlot
- glyphplot
- gplotmatrix
- gscatter
- heatmap
- hist3
- histfit
- manovacluster
- normplot
- parallelcoords
- parallelplot
- ppplot
- probplot
- qqplot
- scatterhist
- scatterhistogram
- silhouette
- stats.chart.BoxChart
- stats.chart.HeatmapChart
- stats.chart.ParallelCoordinatesPlot
- stats.chart.ScatterHistogramChart
- swarmchart
- violin
- wblplot
Function Reference: fitcgam
statistics: Mdl = fitcgam (X, Y)
statistics: Mdl = fitcgam (Tbl, ResponseVarName)
statistics: Mdl = fitcgam (Tbl, formula)
statistics: Mdl = fitcgam (Tbl, Y)
statistics: Mdl = fitcgam (…, name, value)
Fit a Generalized Additive Model (GAM) for binary classification.
Mdl = fitcgam (X, Y) returns a GAM classification
model, Mdl, with X being the predictor data, and Y the
binary class labels of observations in X.
-
Xmust be a N×P numeric matrix of predictor data where rows correspond to observations and columns correspond to features or variables. -
Yis N×1 numeric vector containing binary class labels, typically 0 or 1.
Tbl may stand in place of X, the response named by one of its
variables, written into a model formula holding main effects,
'Y ~ x1 + x2', or given beside it as Y. A variable holding
levels rather than numbers is a categorical predictor without being named
one, and 'CategoricalPredictors' adds to that set rather than
replacing it. PredictorNames and ResponseName come from the
table.
Mdl = fitcgam (…, name, value) returns a
GAM classification model with additional options specified by
Name-Value pair arguments listed below.
Model Parameters
| Name | Value |
|---|---|
'FitMethod' | A character vector selecting the weak
learner, either 'boostedtrees' or 'splines'. The default
is 'boostedtrees', which boosts one shallow decision tree per
predictor and is the scheme MATLAB uses. 'splines' boosts a
smoothing spline per predictor instead and is an Octave extension. The
two take different options and an option meant for one is refused by the
other rather than ignored, so the rows below say which engine each
belongs to. |
'PredictorNames' | A cell array of character vectors specifying the names of the predictors. The length of this array must match the number of columns in X. |
'ResponseName' | A character vector specifying the name of the response variable. |
'ClassNames' | Names of the classes in the class
labels, Y, used for fitting the Discriminant model. ClassNames
are of the same type as the class labels in Y. The model keeps
the classes in this order; by default they are sorted. |
'Cost' | A N×R numeric matrix containing
misclassification cost for the corresponding instances in X where
R is the number of unique categories in Y. If an instance is
correctly classified into its category the cost is calculated to be 1,
otherwise 0. cost matrix can be altered use Mdl.cost = somecost.
default value cost = ones(rows(X),numel(unique(Y))). |
'Formula' | (spline option) A model specification given as a
string in
the form 'Y ~ terms' where Y represents the response variable
and terms the predictor variables. The formula can be used to
specify a subset of variables for training model. For example:
'Y ~ x1 + x2 + x3 + x4 + x1:x2 + x2:x3' specifies four linear terms
for the first four columns of for predictor data, and x1:x2 and
x2:x3 specify the two interaction terms for 1st-2nd and 3rd-4th
columns respectively. Only these terms will be used for training the model,
but X must have at least as many columns as referenced in the formula.
If Predictor Variable names have been defined, then the terms in the formula
must reference to those. When 'formula' is specified, all terms used
for training the model are referenced in the IntMatrix field of the
obj class object as a matrix containing the column indexes for each
term including both the predictors and the interactions used. |
'Interactions' | A logical matrix, a positive integer
scalar, or the string 'all' for defining the interactions between
predictor variables. When given a logical matrix, it must have the same
number of columns as X and each row corresponds to a different
interaction term combining the predictors indexed as true. Each
interaction term is appended as a column vector after the available predictor
column in X. When 'all' is defined, then all possible
combinations of interactions are appended in X before training. At the
moment, parsing a positive integer has the same effect as the 'all'
option. When 'interactions' is specified, only the interaction terms
appended to X are referenced in the IntMatrix field of the
obj class object. |
'Knots' | (spline option) A scalar or a row vector
with the same
columns as X. It defines the knots for fitting a polynomial when
training the GAM. As a scalar, it is expanded to a row vector. The default
value is 5, hence expanded to ones (1, columns (X)) * 5. You can
parse a row vector with different number of knots for each predictor
variable to be fitted with, although not recommended. |
'Order' | (spline option) A scalar or a row vector
with the same
columns as X. It defines the order of the polynomial when training the
GAM. As a scalar, it is expanded to a row vector. The default values is 3,
hence expanded to ones (1, columns (X)) * 3. You can parse a row
vector with different number of polynomial order for each predictor variable
to be fitted with, although not recommended. |
'DoF' | (spline option) A scalar or a row vector
with the same columns
as X. It defines the degrees of freedom for fitting a polynomial when
training the GAM. As a scalar, it is expanded to a row vector. The default
value is 8, hence expanded to ones (1, columns (X)) * 8. You can
parse a row vector with different degrees of freedom for each predictor
variable to be fitted with, although not recommended. |
The rows above marked as spline options require
'FitMethod', 'splines'. The remaining options belong to the
boosted-tree engine and require 'FitMethod', 'boostedtrees', which
is the default.
| Name | Value |
|---|---|
'NumTreesPerPredictor' | A positive integer, the number of boosting rounds of the predictor phase. It is a budget rather than a count: a fit that stops improving ends earlier and reports so. The default is 300. |
'NumTreesPerInteraction' | A positive integer, the same budget for the interaction phase. The default is 100. |
'MaxNumSplitsPerPredictor' | A positive integer, the largest number of splits any one predictor tree may make. The default is 1, which makes each tree a stump. |
'MaxNumSplitsPerInteraction' | The same limit for a tree over a pair of predictors. The default is 4. |
'InitialLearnRateForPredictors' | A value greater than 0 and at most 1, the step a round of the predictor phase starts at. A round that fails to improve the fit is retried at half the step, so this is an initial value rather than a fixed one. The default is 1. |
'InitialLearnRateForInteractions' | The same for the interaction phase. The default is 1. |
'MaxPValue' | A value between 0 and 1. A candidate pair of predictors is kept only if its interaction test gives a p-value no larger than this. The default is 1, which keeps every pair asked for. |
'Verbose' | A non-negative integer. Greater than zero prints a trace of the fit. The default is 0. |
'NumPrint' | A positive integer, how often the trace reports: the first round and then every NumPrint rounds. The default is 10. |
'CategoricalPredictors' | The predictors to treat as
categorical: a vector of column indices, a logical vector with one element
per predictor, or 'all'. A tree splits a categorical predictor
into two sets of levels, and a level not seen in training predicts as a
missing value. Its BinEdges and PairDetectionBinEdges are
empty. The default is none.
A predictor may be named rather than indexed, as a character matrix of one
padded name per row, a string array or a cellstr; a name must match an entry
of 'PredictorNames' exactly, its case included. |
'Weights' | A single or double vector of non-negative
observation weights, one per row of X. Each class carries its
'Prior', spread over its observations in proportion to their weights.
The model’s W keeps the class of the weights, while every computation
runs in double, so Prior and the predictions are double where MATLAB
returns single. |
You can parse either a 'Formula' or an 'Interactions'
optional parameter. Parsing both parameters will result an error.
Accordingly, you can only pass up to two parameters among 'Knots',
'Order', and 'DoF' to define the required polynomial for
training the GAM model.
See also: ClassificationGAM
Source Code: fitcgam
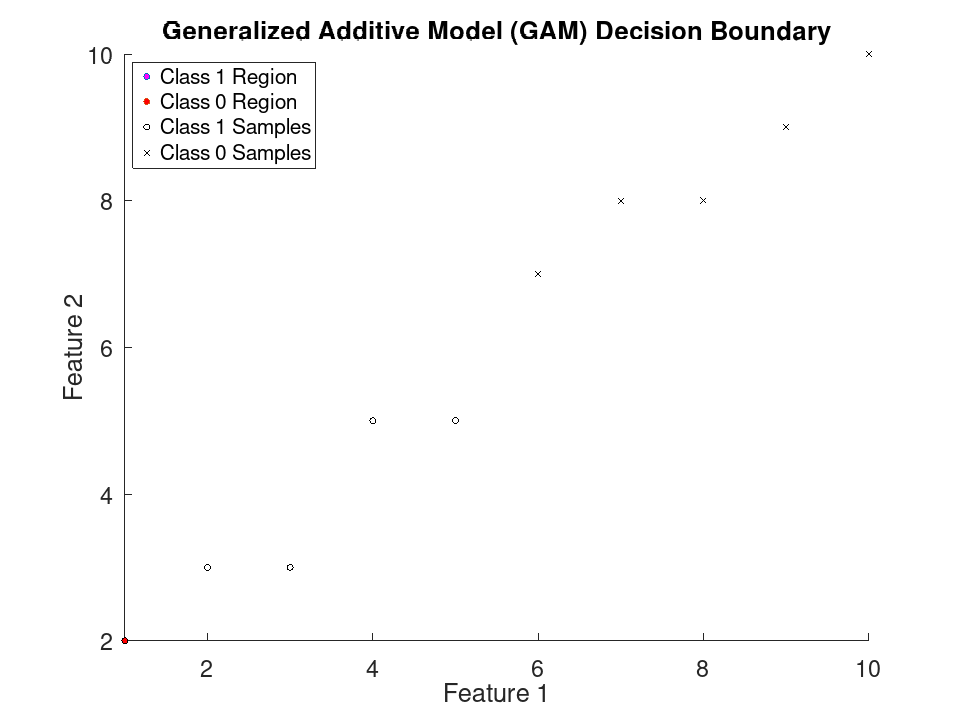
Train a GAM classifier for binary classification using specific data and plot the decision boundaries.
Define specific data
 X = [1, 2; 2, 3; 3, 3; 4, 5; 5, 5; ...
     6, 7; 7, 8; 8, 8; 9, 9; 10, 10];
 Y = [0; 0; 0; 0; 0; ...
     1; 1; 1; 1; 1];
Train the GAM model
obj = fitcgam (X, Y, 'Interactions', 'all');
warning: ClassificationGAM: model does not include interaction terms because all interaction terms have p-values greater than the 'MaxPValue' value, or the software was unable to improve the model fit.
warning: called from
    fitBoosted at line 2583 column 11
    ClassificationGAM at line 1308 column 9
    fitcgam at line 226 column 3
    __eval_demo__ at line 84 column 9
    __demo_notebook__ at line 43 column 3
    __build_demos__ at line 79 column 7
    function_texi2html at line 138 column 5
    package_texi2html at line 350 column 9
Create a grid of values for prediction
 x1 = [min(X(:,1)):0.1:max(X(:,1))];
 x2 = [min(X(:,2)):0.1:max(X(:,2))];
 [x1G, x2G] = meshgrid (x1, x2);
 XGrid = [x1G(:), x2G(:)];
 pred = predict (obj, XGrid);
Plot decision boundaries and data points
 predNumeric = str2double (pred);
 gidx = predNumeric > 0.5;
 figure
 scatter (XGrid(gidx,1), XGrid(gidx,2), 'markerfacecolor', 'magenta');
 hold on
 scatter (XGrid(! gidx,1), XGrid(! gidx,2), 'markerfacecolor', 'red');
 plot (X(Y == 0, 1), X(Y == 0, 2), 'ko', X(Y == 1, 1), X(Y == 1, 2), 'kx');
 xlabel ('Feature 1');
 ylabel ('Feature 2');
 title ('Generalized Additive Model (GAM) Decision Boundary');
 legend ({'Class 1 Region', 'Class 0 Region', ...
       'Class 1 Samples', 'Class 0 Samples'}, ...
       'location', 'northwest')
 axis tight
 hold off
Fit from a table, and predict on one
 load fisheriris
 inds = ! strcmp (species, 'setosa');
 X = meas(inds,:);
 T = table (X(:,1), X(:,2), X(:,3), X(:,4), ...
            'VariableNames', {'SL', 'SW', 'PL', 'PW'});
 T.Species = categorical (species(inds));
A column holding levels is a categorical predictor without being named one
T.Wide = categorical (X(:,2) > 2.9, [false true], {'narrow', 'wide'});
The response is named by its column, and everything else is a predictor
 Mdl = fitcgam (T, 'Species');
 Mdl.PredictorNames
ans =
  1x5 cell array

    {'SL'}    {'SW'}    {'PL'}    {'PW'}    {'Wide'}
Mdl.CategoricalPredictors
ans = 5
predict reads a table by the names the model was fitted on, so the columns may come in any order
 label = predict (Mdl, T(1:5, [6, 5, 4, 3, 2, 1]));
 label'
ans =
  1x5 categorical array

    versicolor    versicolor    versicolor    versicolor    versicolor