Categories &
Functions List
- BetaDistribution
- BinomialDistribution
- BirnbaumSaundersDistribution
- BurrDistribution
- ExponentialDistribution
- ExtremeValueDistribution
- GammaDistribution
- GeneralizedExtremeValueDistribution
- GeneralizedParetoDistribution
- HalfNormalDistribution
- InverseGaussianDistribution
- LogisticDistribution
- LoglogisticDistribution
- LognormalDistribution
- LoguniformDistribution
- MultinomialDistribution
- NakagamiDistribution
- NegativeBinomialDistribution
- NormalDistribution
- PiecewiseLinearDistribution
- PoissonDistribution
- RayleighDistribution
- RicianDistribution
- tLocationScaleDistribution
- TriangularDistribution
- UniformDistribution
- WeibullDistribution
- betafit
- betalike
- binofit
- binolike
- bisafit
- bisalike
- burrfit
- burrlike
- evfit
- evlike
- expfit
- explike
- gamfit
- gamlike
- geofit
- gevfit_lmom
- gevfit
- gevlike
- gpfit
- gplike
- gumbelfit
- gumbellike
- hnfit
- hnlike
- invgfit
- invglike
- logifit
- logilike
- loglfit
- logllike
- lognfit
- lognlike
- nakafit
- nakalike
- nbinfit
- nbinlike
- normfit
- normlike
- poissfit
- poisslike
- raylfit
- rayllike
- ricefit
- ricelike
- tlsfit
- tlslike
- unidfit
- unifit
- wblfit
- wbllike
- betacdf
- betainv
- betapdf
- betarnd
- binocdf
- binoinv
- binopdf
- binornd
- bisacdf
- bisainv
- bisapdf
- bisarnd
- burrcdf
- burrinv
- burrpdf
- burrrnd
- bvncdf
- bvtcdf
- cauchycdf
- cauchyinv
- cauchypdf
- cauchyrnd
- chi2cdf
- chi2inv
- chi2pdf
- chi2rnd
- copulacdf
- copulapdf
- copularnd
- evcdf
- evinv
- evpdf
- evrnd
- expcdf
- expinv
- exppdf
- exprnd
- fcdf
- finv
- fpdf
- frnd
- gamcdf
- gaminv
- gampdf
- gamrnd
- geocdf
- geoinv
- geopdf
- geornd
- gevcdf
- gevinv
- gevpdf
- gevrnd
- gpcdf
- gpinv
- gppdf
- gprnd
- gumbelcdf
- gumbelinv
- gumbelpdf
- gumbelrnd
- hncdf
- hninv
- hnpdf
- hnrnd
- hygecdf
- hygeinv
- hygepdf
- hygernd
- invgcdf
- invginv
- invgpdf
- invgrnd
- iwishpdf
- iwishrnd
- jsucdf
- jsupdf
- laplacecdf
- laplaceinv
- laplacepdf
- laplacernd
- logicdf
- logiinv
- logipdf
- logirnd
- loglcdf
- loglinv
- loglpdf
- loglrnd
- logncdf
- logninv
- lognpdf
- lognrnd
- mnpdf
- mnrnd
- mvncdf
- mvnpdf
- mvnrnd
- mvtcdf
- mvtpdf
- mvtrnd
- mvtcdfqmc
- nakacdf
- nakainv
- nakapdf
- nakarnd
- nbincdf
- nbininv
- nbinpdf
- nbinrnd
- ncfcdf
- ncfinv
- ncfpdf
- ncfrnd
- nctcdf
- nctinv
- nctpdf
- nctrnd
- ncx2cdf
- ncx2inv
- ncx2pdf
- ncx2rnd
- normcdf
- norminv
- normpdf
- normrnd
- plcdf
- plinv
- plpdf
- plrnd
- poisscdf
- poissinv
- poisspdf
- poissrnd
- raylcdf
- raylinv
- raylpdf
- raylrnd
- ricecdf
- riceinv
- ricepdf
- ricernd
- tcdf
- tinv
- tpdf
- trnd
- tlscdf
- tlsinv
- tlspdf
- tlsrnd
- tricdf
- triinv
- tripdf
- trirnd
- unidcdf
- unidinv
- unidpdf
- unidrnd
- unifcdf
- unifinv
- unifpdf
- unifrnd
- vmcdf
- vminv
- vmpdf
- vmrnd
- wblcdf
- wblinv
- wblpdf
- wblrnd
- wienrnd
- wishpdf
- wishrnd
- adtest
- anova
- anova1
- anova2
- anovan
- bartlett_test
- barttest
- binotest
- chi2gof
- chi2test
- correlation_test
- fishertest
- friedman
- hotelling_t2test
- hotelling_t2test2
- kruskalwallis
- kstest
- kstest2
- levene_test
- manova1
- mcnemar_test
- multcompare
- ranksum
- regression_ftest
- regression_ttest
- runstest
- sampsizepwr
- signrank
- signtest
- tiedrank
- ttest
- ttest2
- vartest
- vartest2
- vartestn
- ztest
- ztest2
Function Reference: kstest
statistics: h = kstest (x)
statistics: h = kstest (x, name, value)
statistics: [h, p] = kstest (…)
statistics: [h, p, ksstat, cv] = kstest (…)
Single sample Kolmogorov-Smirnov (K-S) goodness-of-fit hypothesis test.
h = kstest (x) performs a Kolmogorov-Smirnov (K-S) test to
determine if a random sample x could have come from a standard normal
distribution. h indicates the results of the null hypothesis test.
- h = 0 => Do not reject the null hypothesis at the 5% significance
- h = 1 => Reject the null hypothesis at the 5% significance
x is a vector representing a random sample from some unknown distribution with a cumulative distribution function F(X). Missing values declared as NaNs in x are ignored.
h = kstest (x, name, value) returns
a test decision for a single-sample K-S test with additional options
specified by one or more Name-Value pair arguments as shown
below.
| Name | Value | |
|---|---|---|
'alpha' | A numeric scalar between 0 and 1 specifying th the significance level. Default is 0.05 for 5% significance. | |
'CDF' | The hypothesized CDF under the null hypothesis. It can be specified as a function handle of an existing cdf function, a character vector defining a probability distribution with default parameters, a probability distribution object, or a two-column matrix. If not provided, the default is the standard normal, . The one-sample Kolmogorov-Smirnov test is only valid for continuous cumulative distribution functions, and requires the CDF to be predetermined. The result is not accurate if CDF is estimated from the data. | |
'tail' | A string indicating the type of test: |
'unequal' | "F(X) not equal to CDF(X)" (two-sided) (Default) | ||
'larger' | "F(X) > CDF(X)" (one-sided) | ||
'smaller' | "F(X) < CDF(X)" (one-sided) |
Let S(X) be the empirical c.d.f. estimated from the sample vector x,
F(X) be the corresponding true (but unknown) population c.d.f., and CDF be
the known input c.d.f. specified under the null hypothesis.
For tail = "unequal", "larger", and "smaller", the test statistics are
max|S(X) - CDF(X)|, max[S(X) - CDF(X)], and max[CDF(X) - S(X)], respectively.
[h, p] = kstest (…) also returns the asymptotic
p-value p.
[h, p, ksstat] = kstest (…) returns the K-S
test statistic ksstat defined above for the test type indicated by the
"tail" option
In the matrix version of CDF, column 1 contains the x-axis data and column 2 the corresponding y-axis c.d.f data. Since the K-S test statistic will occur at one of the observations in x, the calculation is most efficient when CDF is only specified at the observations in x. When column 1 of CDF represents x-axis points independent of x, CDF is linearly interpolated at the observations found in the vector x. In this case, the interval along the x-axis (the column 1 spread of CDF) must span the observations in x for successful interpolation.
The decision to reject the null hypothesis is based on comparing the p-value p with the "alpha" value, not by comparing the statistic ksstat with the critical value cv. cv is computed separately using an approximate formula or by interpolation using Miller’s approximation table. The formula and table cover the range 0.01 <= "alpha" <= 0.2 for two-sided tests and 0.005 <= "alpha" <= 0.1 for one-sided tests. CV is returned as NaN if "alpha" is outside this range. Since CV is approximate, a comparison of ksstat with cv may occasionally lead to a different conclusion than a comparison of p with "alpha".
Source Code: kstest
Example: 1
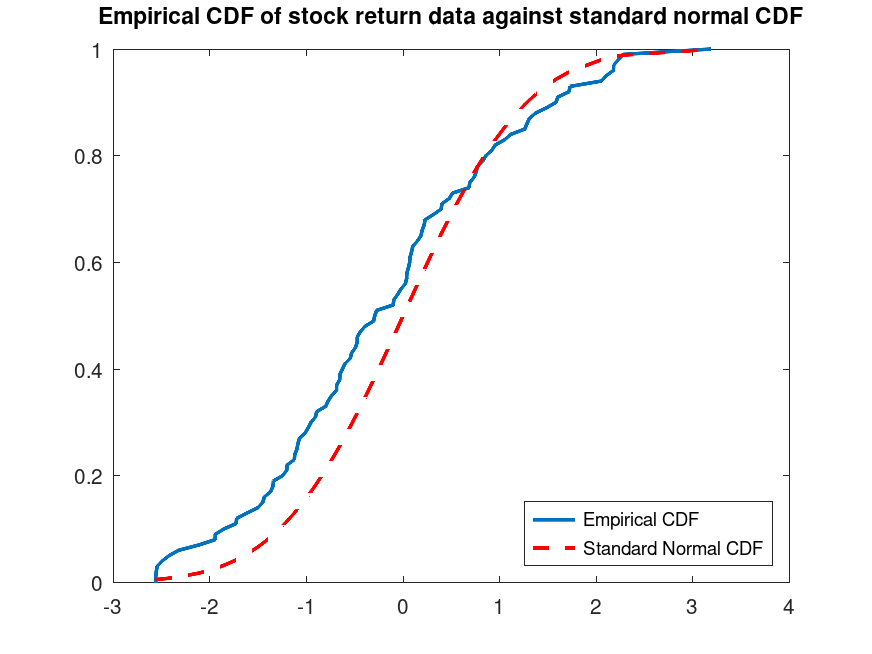
Use the stock return data set to test the null hypothesis that the data come from a standard normal distribution against the alternative hypothesis that the population CDF of the data is larger that the standard normal CDF.
 load stockreturns;
 x = stocks(:,2);
 [h, p, k, c] = kstest (x, 'Tail', 'larger')
h = 1
p = 0.015286
k = 0.1428
c = 0.1207
Compute the empirical CDF and plot against the standard normal CDF
 [f, x_values] = ecdf (x);
 h1 = plot (x_values, f);
 hold on;
 h2 = plot (x_values, normcdf (x_values), 'r--');
 set (h1, 'LineWidth', 2);
 set (h2, 'LineWidth', 2);
 legend ([h1, h2], 'Empirical CDF', 'Standard Normal CDF', ...
         'Location', 'southeast');
 title ('Empirical CDF of stock return data against standard normal CDF')