Categories &
Functions List
- BetaDistribution
- BinomialDistribution
- BirnbaumSaundersDistribution
- BurrDistribution
- ExponentialDistribution
- ExtremeValueDistribution
- GammaDistribution
- GeneralizedExtremeValueDistribution
- GeneralizedParetoDistribution
- HalfNormalDistribution
- InverseGaussianDistribution
- LogisticDistribution
- LoglogisticDistribution
- LognormalDistribution
- LoguniformDistribution
- MultinomialDistribution
- NakagamiDistribution
- NegativeBinomialDistribution
- NormalDistribution
- PiecewiseLinearDistribution
- PoissonDistribution
- RayleighDistribution
- RicianDistribution
- tLocationScaleDistribution
- TriangularDistribution
- UniformDistribution
- WeibullDistribution
- betafit
- betalike
- binofit
- binolike
- bisafit
- bisalike
- burrfit
- burrlike
- evfit
- evlike
- expfit
- explike
- gamfit
- gamlike
- geofit
- gevfit_lmom
- gevfit
- gevlike
- gpfit
- gplike
- gumbelfit
- gumbellike
- hnfit
- hnlike
- invgfit
- invglike
- logifit
- logilike
- loglfit
- logllike
- lognfit
- lognlike
- nakafit
- nakalike
- nbinfit
- nbinlike
- normfit
- normlike
- poissfit
- poisslike
- raylfit
- rayllike
- ricefit
- ricelike
- tlsfit
- tlslike
- unidfit
- unifit
- wblfit
- wbllike
- betacdf
- betainv
- betapdf
- betarnd
- binocdf
- binoinv
- binopdf
- binornd
- bisacdf
- bisainv
- bisapdf
- bisarnd
- burrcdf
- burrinv
- burrpdf
- burrrnd
- bvncdf
- bvtcdf
- cauchycdf
- cauchyinv
- cauchypdf
- cauchyrnd
- chi2cdf
- chi2inv
- chi2pdf
- chi2rnd
- copulacdf
- copulapdf
- copularnd
- evcdf
- evinv
- evpdf
- evrnd
- expcdf
- expinv
- exppdf
- exprnd
- fcdf
- finv
- fpdf
- frnd
- gamcdf
- gaminv
- gampdf
- gamrnd
- geocdf
- geoinv
- geopdf
- geornd
- gevcdf
- gevinv
- gevpdf
- gevrnd
- gpcdf
- gpinv
- gppdf
- gprnd
- gumbelcdf
- gumbelinv
- gumbelpdf
- gumbelrnd
- hncdf
- hninv
- hnpdf
- hnrnd
- hygecdf
- hygeinv
- hygepdf
- hygernd
- invgcdf
- invginv
- invgpdf
- invgrnd
- iwishpdf
- iwishrnd
- jsucdf
- jsupdf
- laplacecdf
- laplaceinv
- laplacepdf
- laplacernd
- logicdf
- logiinv
- logipdf
- logirnd
- loglcdf
- loglinv
- loglpdf
- loglrnd
- logncdf
- logninv
- lognpdf
- lognrnd
- mnpdf
- mnrnd
- mvncdf
- mvnpdf
- mvnrnd
- mvtcdf
- mvtpdf
- mvtrnd
- mvtcdfqmc
- nakacdf
- nakainv
- nakapdf
- nakarnd
- nbincdf
- nbininv
- nbinpdf
- nbinrnd
- ncfcdf
- ncfinv
- ncfpdf
- ncfrnd
- nctcdf
- nctinv
- nctpdf
- nctrnd
- ncx2cdf
- ncx2inv
- ncx2pdf
- ncx2rnd
- normcdf
- norminv
- normpdf
- normrnd
- plcdf
- plinv
- plpdf
- plrnd
- poisscdf
- poissinv
- poisspdf
- poissrnd
- raylcdf
- raylinv
- raylpdf
- raylrnd
- ricecdf
- riceinv
- ricepdf
- ricernd
- tcdf
- tinv
- tpdf
- trnd
- tlscdf
- tlsinv
- tlspdf
- tlsrnd
- tricdf
- triinv
- tripdf
- trirnd
- unidcdf
- unidinv
- unidpdf
- unidrnd
- unifcdf
- unifinv
- unifpdf
- unifrnd
- vmcdf
- vminv
- vmpdf
- vmrnd
- wblcdf
- wblinv
- wblpdf
- wblrnd
- wienrnd
- wishpdf
- wishrnd
- adtest
- anova
- anova1
- anova2
- anovan
- bartlett_test
- barttest
- binotest
- chi2gof
- chi2test
- correlation_test
- fishertest
- friedman
- hotelling_t2test
- hotelling_t2test2
- kruskalwallis
- kstest
- kstest2
- levene_test
- manova1
- mcnemar_test
- multcompare
- ranksum
- regression_ftest
- regression_ttest
- runstest
- sampsizepwr
- signrank
- signtest
- tiedrank
- ttest
- ttest2
- vartest
- vartest2
- vartestn
- ztest
- ztest2
Function Reference: confusionchart
statistics: confusionchart (trueLabels, predictedLabels)
statistics: confusionchart (m)
statistics: confusionchart (m, classLabels)
statistics: confusionchart (parent, …)
statistics: confusionchart (…, prop, val, …)
statistics: cm = confusionchart (…)
Display a chart of a confusion matrix.
The two vectors of values trueLabels and predictedLabels, which
are used to compute the confusion matrix, must be defined with the same
format as the inputs of confusionmat.
Otherwise a confusion matrix m as computed by confusionmat can
be given.
classLabels is an array of labels, i.e. the list of the class names.
If the first argument is a handle to a figure or to a uipanel,
then the confusion matrix chart is displayed inside that object.
Optional property/value pairs are passed directly to the underlying objects,
e.g. 'xlabel', 'ylabel', 'title', 'fontname',
'fontsize' etc.
The optional return value cm is a ConfusionMatrixChart object.
Specific properties of a ConfusionMatrixChart object are:
-
'DiagonalColor'The color of the patches on the diagonal, default is [0.0, 0.4471, 0.7412]. -
'OffDiagonalColor'The color of the patches off the diagonal, default is [0.851, 0.3255, 0.098]. -
'GridVisible'Available values:on(default),off. -
'Normalization'Available values:absolute(default),column-normalized,row-normalized,total-normalized. -
'ColumnSummary'Available values:off(default),absolute,column-normalized,total-normalized. -
'RowSummary'Available values:off(default),absolute,row-normalized,total-normalized.
Run demo confusionchart to see some examples.
See also: confusionmat, sortClasses
Source Code: confusionchart
Example: 1
close all
Setting the chart properties
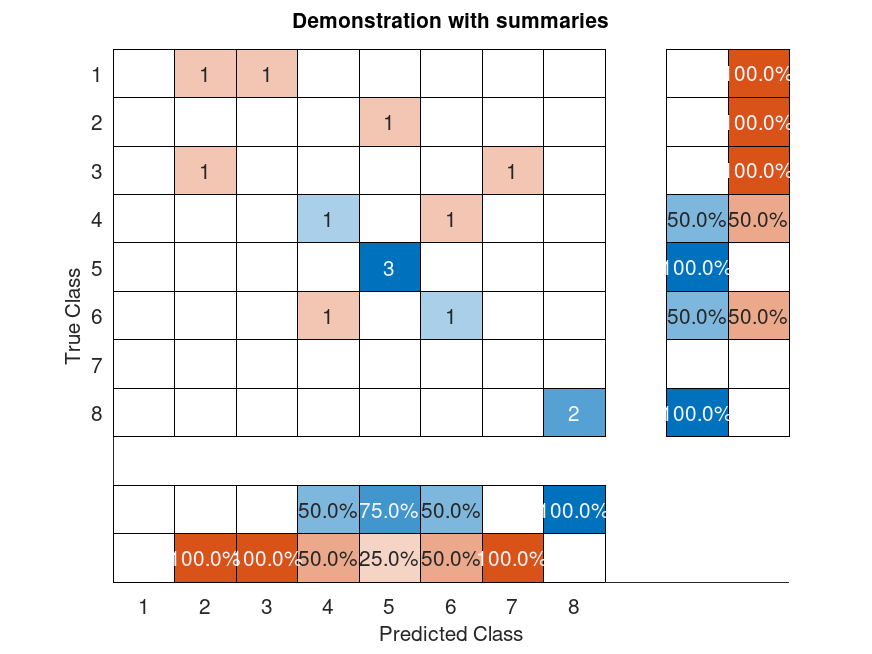
 Yt = [8 5 6 8 5 3 1 6 4 2 5 3 1 4]';
 Yp = [8 5 6 8 5 2 3 4 4 5 5 7 2 6]';
 confusionchart (Yt, Yp, 'Title', ...
   'Demonstration with summaries','Normalization',...
   'absolute','ColumnSummary', 'column-normalized','RowSummary',...
   'row-normalized')
ans =

ConfusionMatrixChart with properties:

	NormalizedValues: [ 8x8 double ]
	ClassLabels: { 8x1 cell }
Example: 2
close all
Cellstr as inputs
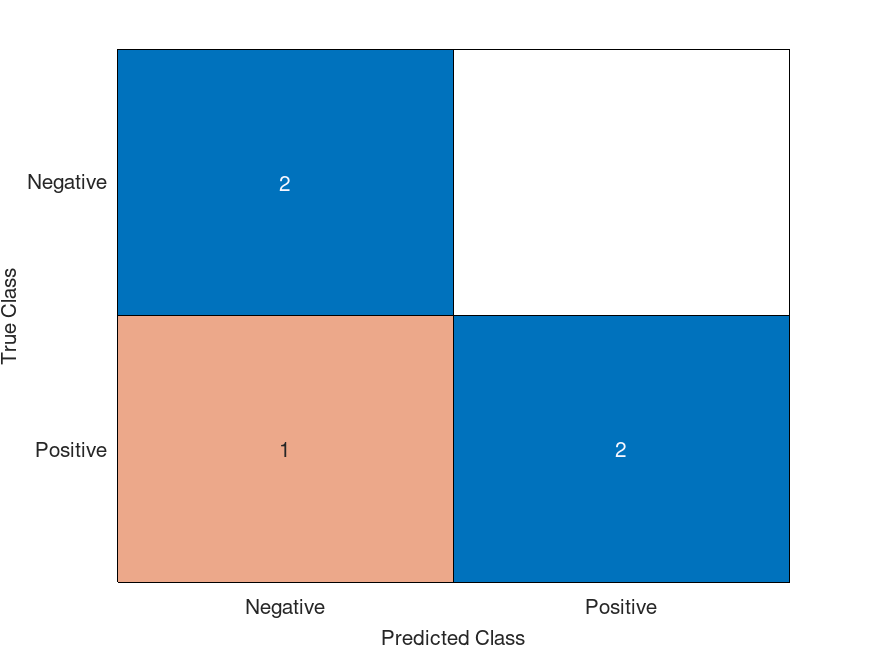
 Yt = {'Positive', 'Positive', 'Positive', 'Negative', 'Negative'};
 Yp = {'Positive', 'Positive', 'Negative', 'Negative', 'Negative'};
 m = confusionmat (Yt, Yp);
 confusionchart (m, {'Positive', 'Negative'});
 hold off
Example: 3
close all
Editing the object properties
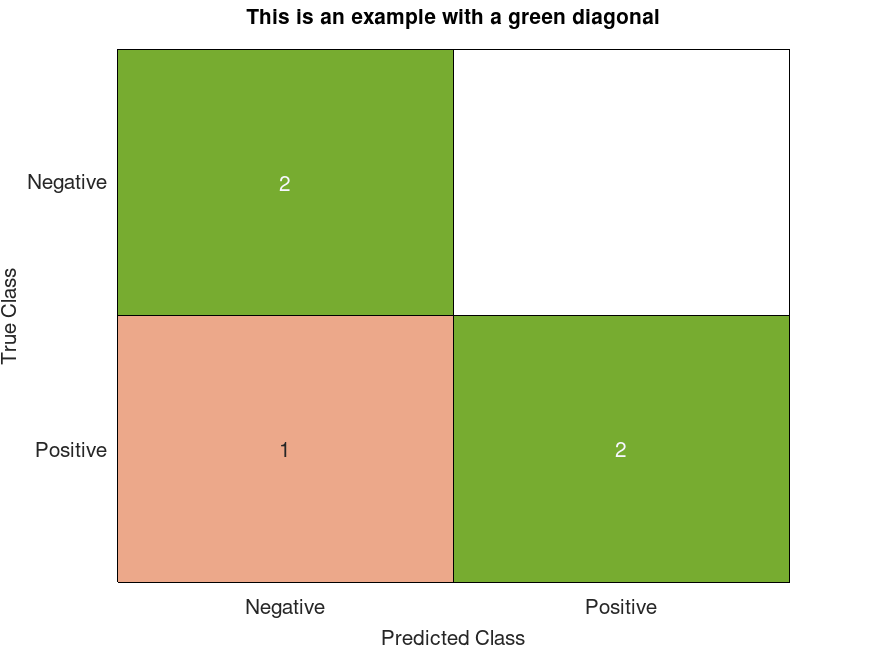
 Yt = {'Positive', 'Positive', 'Positive', 'Negative', 'Negative'};
 Yp = {'Positive', 'Positive', 'Negative', 'Negative', 'Negative'};
 cm = confusionchart (Yt, Yp);
 cm.Title = 'This is an example with a green diagonal';
 cm.DiagonalColor = [0.4660, 0.6740, 0.1880];
 hold off
Example: 5
close all
Sorting classes
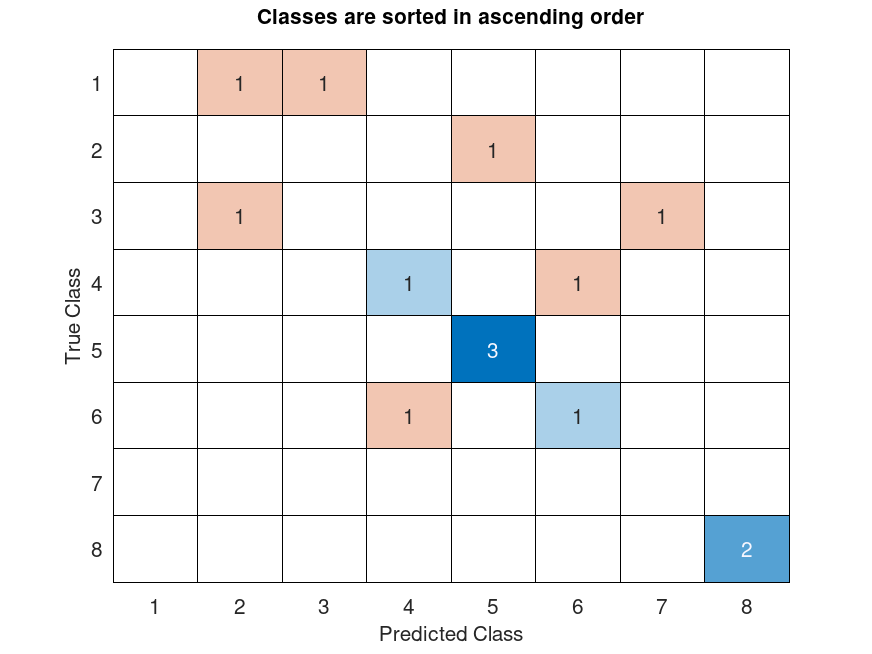
 Yt = [8 5 6 8 5 3 1 6 4 2 5 3 1 4]';
 Yp = [8 5 6 8 5 2 3 4 4 5 5 7 2 6]';
 cm = confusionchart (Yt, Yp, 'Title', ...
   'Classes are sorted in ascending order');
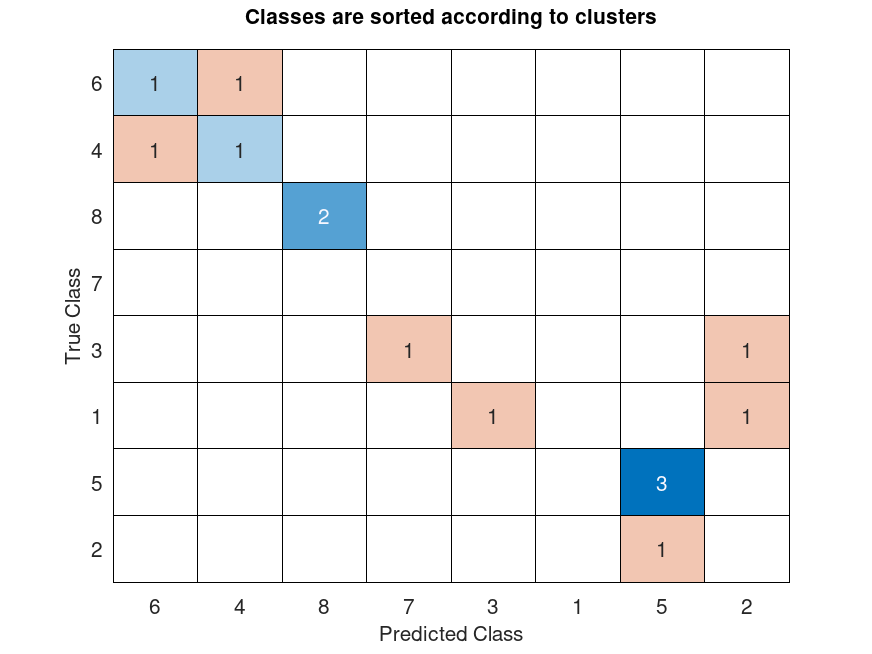
 cm = confusionchart (Yt, Yp, 'Title', ...
   'Classes are sorted according to clusters');
 sortClasses (cm, 'cluster');