Categories &
Functions List
- BetaDistribution
- BinomialDistribution
- BirnbaumSaundersDistribution
- BurrDistribution
- ExponentialDistribution
- ExtremeValueDistribution
- GammaDistribution
- GeneralizedExtremeValueDistribution
- GeneralizedParetoDistribution
- HalfNormalDistribution
- InverseGaussianDistribution
- LogisticDistribution
- LoglogisticDistribution
- LognormalDistribution
- LoguniformDistribution
- MultinomialDistribution
- NakagamiDistribution
- NegativeBinomialDistribution
- NormalDistribution
- PiecewiseLinearDistribution
- PoissonDistribution
- RayleighDistribution
- RicianDistribution
- tLocationScaleDistribution
- TriangularDistribution
- UniformDistribution
- WeibullDistribution
- betafit
- betalike
- binofit
- binolike
- bisafit
- bisalike
- burrfit
- burrlike
- evfit
- evlike
- expfit
- explike
- gamfit
- gamlike
- geofit
- gevfit_lmom
- gevfit
- gevlike
- gpfit
- gplike
- gumbelfit
- gumbellike
- hnfit
- hnlike
- invgfit
- invglike
- logifit
- logilike
- loglfit
- logllike
- lognfit
- lognlike
- nakafit
- nakalike
- nbinfit
- nbinlike
- normfit
- normlike
- poissfit
- poisslike
- raylfit
- rayllike
- ricefit
- ricelike
- tlsfit
- tlslike
- unidfit
- unifit
- wblfit
- wbllike
- betacdf
- betainv
- betapdf
- betarnd
- binocdf
- binoinv
- binopdf
- binornd
- bisacdf
- bisainv
- bisapdf
- bisarnd
- burrcdf
- burrinv
- burrpdf
- burrrnd
- bvncdf
- bvtcdf
- cauchycdf
- cauchyinv
- cauchypdf
- cauchyrnd
- chi2cdf
- chi2inv
- chi2pdf
- chi2rnd
- copulacdf
- copulapdf
- copularnd
- evcdf
- evinv
- evpdf
- evrnd
- expcdf
- expinv
- exppdf
- exprnd
- fcdf
- finv
- fpdf
- frnd
- gamcdf
- gaminv
- gampdf
- gamrnd
- geocdf
- geoinv
- geopdf
- geornd
- gevcdf
- gevinv
- gevpdf
- gevrnd
- gpcdf
- gpinv
- gppdf
- gprnd
- gumbelcdf
- gumbelinv
- gumbelpdf
- gumbelrnd
- hncdf
- hninv
- hnpdf
- hnrnd
- hygecdf
- hygeinv
- hygepdf
- hygernd
- invgcdf
- invginv
- invgpdf
- invgrnd
- iwishpdf
- iwishrnd
- jsucdf
- jsupdf
- laplacecdf
- laplaceinv
- laplacepdf
- laplacernd
- logicdf
- logiinv
- logipdf
- logirnd
- loglcdf
- loglinv
- loglpdf
- loglrnd
- logncdf
- logninv
- lognpdf
- lognrnd
- mnpdf
- mnrnd
- mvncdf
- mvnpdf
- mvnrnd
- mvtcdf
- mvtpdf
- mvtrnd
- mvtcdfqmc
- nakacdf
- nakainv
- nakapdf
- nakarnd
- nbincdf
- nbininv
- nbinpdf
- nbinrnd
- ncfcdf
- ncfinv
- ncfpdf
- ncfrnd
- nctcdf
- nctinv
- nctpdf
- nctrnd
- ncx2cdf
- ncx2inv
- ncx2pdf
- ncx2rnd
- normcdf
- norminv
- normpdf
- normrnd
- plcdf
- plinv
- plpdf
- plrnd
- poisscdf
- poissinv
- poisspdf
- poissrnd
- raylcdf
- raylinv
- raylpdf
- raylrnd
- ricecdf
- riceinv
- ricepdf
- ricernd
- tcdf
- tinv
- tpdf
- trnd
- tlscdf
- tlsinv
- tlspdf
- tlsrnd
- tricdf
- triinv
- tripdf
- trirnd
- unidcdf
- unidinv
- unidpdf
- unidrnd
- unifcdf
- unifinv
- unifpdf
- unifrnd
- vmcdf
- vminv
- vmpdf
- vmrnd
- wblcdf
- wblinv
- wblpdf
- wblrnd
- wienrnd
- wishpdf
- wishrnd
- adtest
- anova
- anova1
- anova2
- anovan
- bartlett_test
- barttest
- binotest
- chi2gof
- chi2test
- correlation_test
- fishertest
- friedman
- hotelling_t2test
- hotelling_t2test2
- kruskalwallis
- kstest
- kstest2
- levene_test
- manova1
- mcnemar_test
- multcompare
- ranksum
- regression_ftest
- regression_ttest
- runstest
- sampsizepwr
- signrank
- signtest
- tiedrank
- ttest
- ttest2
- vartest
- vartest2
- vartestn
- ztest
- ztest2
Function Reference: kruskalwallis
statistics: p = kruskalwallis (x)
statistics: p = kruskalwallis (x, group)
statistics: p = kruskalwallis (x, group, displayopt)
statistics: [p, tbl] = kruskalwallis (x, …)
statistics: [p, tbl, stats] = kruskalwallis (x, …)
Perform a Kruskal-Wallis test, the non-parametric alternative of a one-way analysis of variance (ANOVA), for comparing the means of two or more groups of data under the null hypothesis that the groups are drawn from the same population, i.e. the group means are equal.
kruskalwallis can take up to three input arguments:
- x contains the data and it can either be a vector or matrix. If x is a matrix, then each column is treated as a separate group. If x is a vector, then the group argument is mandatory.
- group contains the names for each group. If x is a matrix, then group can either be a cell array of strings of a character array, with one row per column of x. If you want to omit this argument, enter an empty array ([]). If x is a vector, then group must be a vector of the same length, or a string array or cell array of strings with one row for each element of x. x values corresponding to the same value of group are placed in the same group.
- displayopt is an optional parameter for displaying the groups contained in the data in a boxplot. If omitted, it is ’on’ by default. If group names are defined in group, these are used to identify the groups in the boxplot. Use ’off’ to omit displaying this figure.
kruskalwallis can return up to three output arguments:
- p is the p-value of the null hypothesis that all group means are equal.
- tbl is a cell array containing the results in a standard ANOVA table.
- stats is a structure containing statistics useful for performing a multiple comparison of means with the MULTCOMPARE function.
If kruskalwallis is called without any output arguments, then it prints the results in a one-way ANOVA table to the standard output. It is also printed when displayopt is ’on’.
Examples:
x = meshgrid (1:6); x = x + normrnd (0, 1, 6, 6); [p, atab] = kruskalwallis(x); |
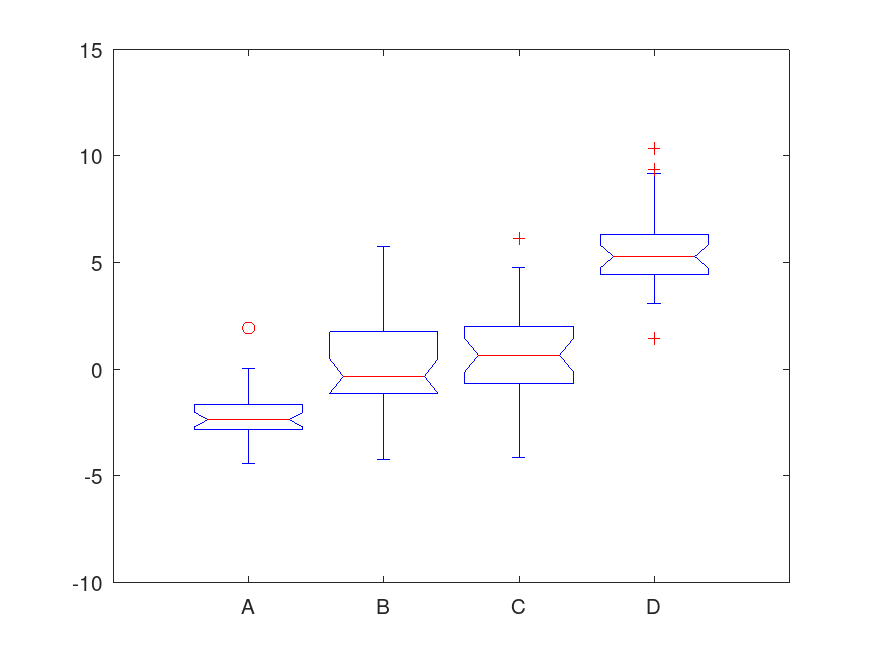
 x = ones (50, 4) .* [-2, 0, 1, 5];
 x = x + normrnd (0, 2, 50, 4);
 group = {"A", "B", "C", "D"};
 kruskalwallis (x, group);
|
Source Code: kruskalwallis
Example: 1
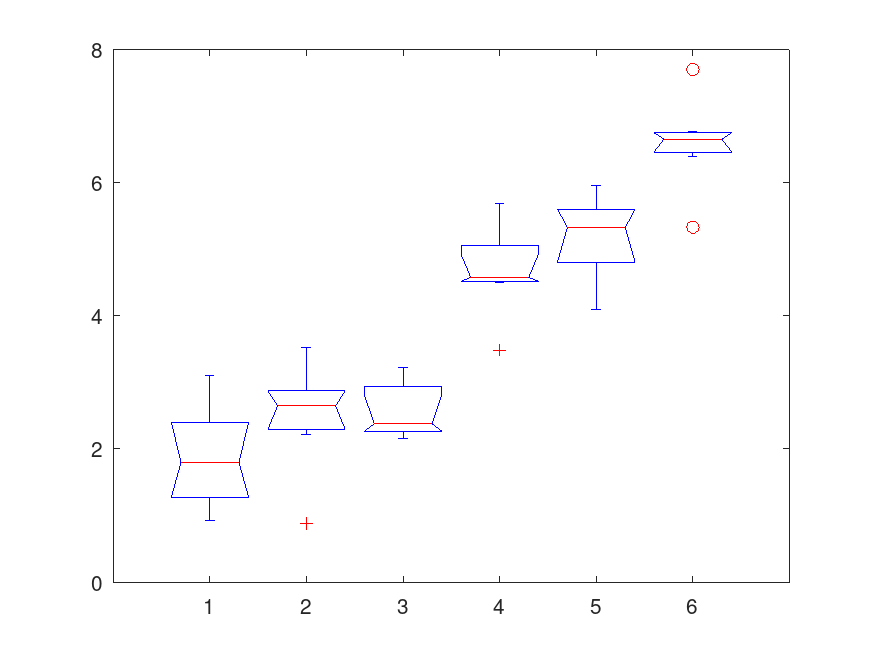
 x = meshgrid (1:6);
 x = x + normrnd (0, 1, 6, 6);
 kruskalwallis (x, [], 'off');
              Kruskal-Wallis ANOVA Table
Source        SS      df      MS      Chi-sq  Prob>Chi-sq
---------------------------------------------------------
Columns    3139.67     5     627.93    28.29  3.20103e-05
Error       745.33    30      24.84
Total      3885.00    35
Example: 2
 x = meshgrid (1:6);
 x = x + normrnd (0, 1, 6, 6);
 [p, atab] = kruskalwallis (x);
              Kruskal-Wallis ANOVA Table
Source        SS      df      MS      Chi-sq  Prob>Chi-sq
---------------------------------------------------------
Columns    3232.33     5     646.47    29.12  2.19627e-05
Error       652.67    30      21.76
Total      3885.00    35
Example: 3
 x = ones (30, 4) .* [-2, 0, 1, 5];
 x = x + normrnd (0, 2, 30, 4);
 group = {'A', 'B', 'C', 'D'};
 kruskalwallis (x, group);
              Kruskal-Wallis ANOVA Table
Source        SS      df      MS      Chi-sq  Prob>Chi-sq
---------------------------------------------------------
Columns   93937.00     3   31312.33    77.63  1.11022e-16
Error     50053.00   116     431.49
Total    143990.00   119