Categories &
Functions List
- BetaDistribution
- BinomialDistribution
- BirnbaumSaundersDistribution
- BurrDistribution
- ExponentialDistribution
- ExtremeValueDistribution
- GammaDistribution
- GeneralizedExtremeValueDistribution
- GeneralizedParetoDistribution
- HalfNormalDistribution
- InverseGaussianDistribution
- LogisticDistribution
- LoglogisticDistribution
- LognormalDistribution
- LoguniformDistribution
- MultinomialDistribution
- NakagamiDistribution
- NegativeBinomialDistribution
- NormalDistribution
- PiecewiseLinearDistribution
- PoissonDistribution
- RayleighDistribution
- RicianDistribution
- tLocationScaleDistribution
- TriangularDistribution
- UniformDistribution
- WeibullDistribution
- betafit
- betalike
- binofit
- binolike
- bisafit
- bisalike
- burrfit
- burrlike
- evfit
- evlike
- expfit
- explike
- gamfit
- gamlike
- geofit
- gevfit_lmom
- gevfit
- gevlike
- gpfit
- gplike
- gumbelfit
- gumbellike
- hnfit
- hnlike
- invgfit
- invglike
- logifit
- logilike
- loglfit
- logllike
- lognfit
- lognlike
- nakafit
- nakalike
- nbinfit
- nbinlike
- normfit
- normlike
- poissfit
- poisslike
- raylfit
- rayllike
- ricefit
- ricelike
- tlsfit
- tlslike
- unidfit
- unifit
- wblfit
- wbllike
- betacdf
- betainv
- betapdf
- betarnd
- binocdf
- binoinv
- binopdf
- binornd
- bisacdf
- bisainv
- bisapdf
- bisarnd
- burrcdf
- burrinv
- burrpdf
- burrrnd
- bvncdf
- bvtcdf
- cauchycdf
- cauchyinv
- cauchypdf
- cauchyrnd
- chi2cdf
- chi2inv
- chi2pdf
- chi2rnd
- copulacdf
- copulapdf
- copularnd
- evcdf
- evinv
- evpdf
- evrnd
- expcdf
- expinv
- exppdf
- exprnd
- fcdf
- finv
- fpdf
- frnd
- gamcdf
- gaminv
- gampdf
- gamrnd
- geocdf
- geoinv
- geopdf
- geornd
- gevcdf
- gevinv
- gevpdf
- gevrnd
- gpcdf
- gpinv
- gppdf
- gprnd
- gumbelcdf
- gumbelinv
- gumbelpdf
- gumbelrnd
- hncdf
- hninv
- hnpdf
- hnrnd
- hygecdf
- hygeinv
- hygepdf
- hygernd
- invgcdf
- invginv
- invgpdf
- invgrnd
- iwishpdf
- iwishrnd
- jsucdf
- jsupdf
- laplacecdf
- laplaceinv
- laplacepdf
- laplacernd
- logicdf
- logiinv
- logipdf
- logirnd
- loglcdf
- loglinv
- loglpdf
- loglrnd
- logncdf
- logninv
- lognpdf
- lognrnd
- mnpdf
- mnrnd
- mvncdf
- mvnpdf
- mvnrnd
- mvtcdf
- mvtpdf
- mvtrnd
- mvtcdfqmc
- nakacdf
- nakainv
- nakapdf
- nakarnd
- nbincdf
- nbininv
- nbinpdf
- nbinrnd
- ncfcdf
- ncfinv
- ncfpdf
- ncfrnd
- nctcdf
- nctinv
- nctpdf
- nctrnd
- ncx2cdf
- ncx2inv
- ncx2pdf
- ncx2rnd
- normcdf
- norminv
- normpdf
- normrnd
- plcdf
- plinv
- plpdf
- plrnd
- poisscdf
- poissinv
- poisspdf
- poissrnd
- raylcdf
- raylinv
- raylpdf
- raylrnd
- ricecdf
- riceinv
- ricepdf
- ricernd
- tcdf
- tinv
- tpdf
- trnd
- tlscdf
- tlsinv
- tlspdf
- tlsrnd
- tricdf
- triinv
- tripdf
- trirnd
- unidcdf
- unidinv
- unidpdf
- unidrnd
- unifcdf
- unifinv
- unifpdf
- unifrnd
- vmcdf
- vminv
- vmpdf
- vmrnd
- wblcdf
- wblinv
- wblpdf
- wblrnd
- wienrnd
- wishpdf
- wishrnd
- adtest
- anova1
- anova2
- anovan
- bartlett_test
- barttest
- binotest
- chi2gof
- chi2test
- correlation_test
- fishertest
- friedman
- hotelling_t2test
- hotelling_t2test2
- kruskalwallis
- kstest
- kstest2
- levene_test
- manova1
- mcnemar_test
- multcompare
- ranksum
- regression_ftest
- regression_ttest
- runstest
- sampsizepwr
- signrank
- signtest
- tiedrank
- ttest
- ttest2
- vartest
- vartest2
- vartestn
- ztest
- ztest2
Function Reference: fitlm
statistics: tab = fitlm (X, y)
statistics: tab = fitlm (X, y, name, value)
statistics: tab = fitlm (X, y, modelspec)
statistics: tab = fitlm (X, y, modelspec, name, value)
statistics: [tab] = fitlm (…)
statistics: [tab, stats] = fitlm (…)
statistics: [tab, stats] = fitlm (…)
Regress the continuous outcome (i.e. dependent variable) y on
continuous or categorical predictors (i.e. independent variables) X
by minimizing the sum-of-squared residuals. Unless requested otherwise,
fitlm prints the model formula, the regression coefficients (i.e.
parameters/contrasts) and an ANOVA table. Note that unlike anovan,
fitlm treats all factors as continuous by default. A bootstrap
resampling variant of this function, bootlm, is available in the
statistics-resampling package and has similar usage.
X must be a column major matrix or cell array consisting of the predictors. A constant term (intercept) should not be included in X - it is automatically added to the model. y must be a column vector corresponding to the outcome variable. modelspec can specified as one of the following:
- "constant" : model contains only a constant (intercept) term.
- "linear" (default) : model contains an intercept and linear term for each predictor.
- "interactions" : model contains an intercept, linear term for each predictor and all products of pairs of distinct predictors.
- "full" : model contains an intercept, linear term for each predictor and all combinations of the predictors.
- a matrix of term definitions : an t-by-(N+1) matrix specifying terms in a model, where t is the number of terms, N is the number of predictor variables, and +1 accounts for the outcome variable. The outcome variable is the last column in the terms matrix and must be a column of zeros. An intercept must be specified in the first row of the terms matrix and must be a row of zeros.
fitlm can take a number of optional parameters as name-value pairs.
[…] = fitlm (..., "CategoricalVars", categorical)
- categorical is a vector of indices indicating which of the columns (i.e. variables) in X should be treated as categorical predictors rather than as continuous predictors.
fitlm also accepts optional anovan parameters as name-value
pairs (except for the "model" parameter). The accepted parameter names from
anovan and their default values in fitlm are:
- CONTRASTS : "treatment"
- SSTYPE: 2
- ALPHA: 0.05
- DISPLAY: "on"
- WEIGHTS: [] (empty)
- RANDOM: [] (empty)
- CONTINUOUS: [1:N]
- VARNAMES: [] (empty)
Type ’help anovan’ to find out more about what these options do.
fitlm can return up to two output arguments:
[tab] = fitlm (…) returns a cell array containing a table of model parameters
[tab, stats] = fitlm (…) returns a structure
containing additional statistics, including degrees of freedom and effect
sizes for each term in the linear model, the design matrix, the
variance-covariance matrix, (weighted) model residuals, and the mean squared
error. The columns of stats.coeffs (from left-to-right) report the
model coefficients, standard errors, lower and upper 100*(1-alpha)%
confidence interval bounds, t-statistics, and p-values relating to the
contrasts. The number appended to each term name in stats.coeffnames
corresponds to the column number in the relevant contrast matrix for that
factor. The stats structure can be used as input for multcompare.
Note that if the model contains a continuous variable and you wish to use
the STATS output as input to multcompare, then the model needs
to be refit with the "contrast" parameter set to a sum-to-zero contrast
coding scheme, e.g."simple".
See also: anovan, multcompare
Source Code: fitlm
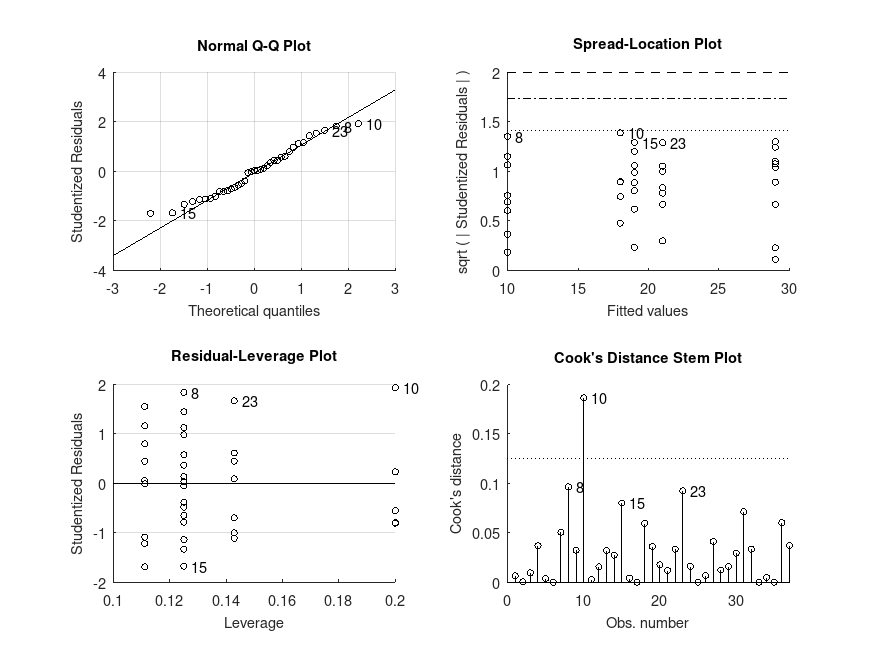
Example: 1
 y =  [ 8.706 10.362 11.552  6.941 10.983 10.092  6.421 14.943 15.931 ...
        22.968 18.590 16.567 15.944 21.637 14.492 17.965 18.851 22.891 ...
        22.028 16.884 17.252 18.325 25.435 19.141 21.238 22.196 18.038 ...
        22.628 31.163 26.053 24.419 32.145 28.966 30.207 29.142 33.212 ...
        25.694 ]';
 X = [1 1 1 1 1 1 1 1 2 2 2 2 2 3 3 3 3 3 3 3 3 4 4 4 4 4 4 4 5 5 5 5 5 5 5 5 5]';

 [TAB,STATS] = fitlm (X,y,"linear","CategoricalVars",1,"display","on");


MODEL FORMULA (based on Wilkinson's notation):

Y ~ 1 + X1

MODEL PARAMETERS (contrasts for the fixed effects)

Parameter               Estimate        SE  Lower.CI  Upper.CI        t Prob>|t|
--------------------------------------------------------------------------------
(Intercept)                   10      1.02      7.93      12.1     9.83    <.001
X1_1                           8      1.64      4.66      11.3     4.87    <.001
X1_2                           9      1.44      6.07      11.9     6.25    <.001
X1_3                          11      1.49      7.97        14     7.38    <.001
X1_4                          19       1.4      16.2      21.8    13.58    <.001

ANOVA TABLE (Type II sums-of-squares):

Source                   Sum Sq.    d.f.    Mean Sq.  R Sq.            F  Prob>F
--------------------------------------------------------------------------------
X1                        1561.3       4      390.33  0.855        47.10   <.001
Error                     265.17      32      8.2866
Total                     1826.5      36
|

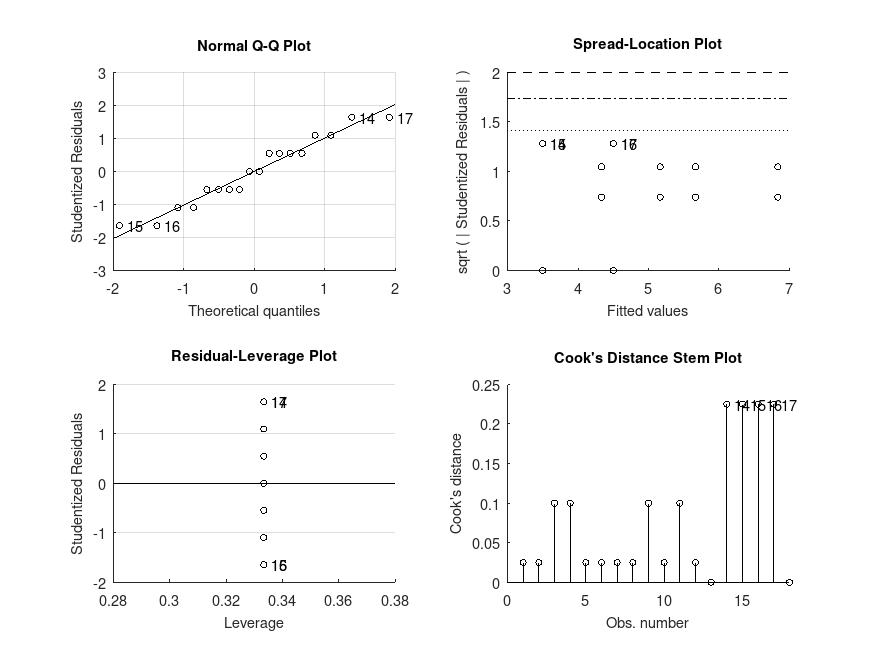
Example: 2
 popcorn = [5.5, 4.5, 3.5; 5.5, 4.5, 4.0; 6.0, 4.0, 3.0; ...
            6.5, 5.0, 4.0; 7.0, 5.5, 5.0; 7.0, 5.0, 4.5];
 brands = {'Gourmet', 'National', 'Generic'; ...
           'Gourmet', 'National', 'Generic'; ...
           'Gourmet', 'National', 'Generic'; ...
           'Gourmet', 'National', 'Generic'; ...
           'Gourmet', 'National', 'Generic'; ...
           'Gourmet', 'National', 'Generic'};
 popper = {'oil', 'oil', 'oil'; 'oil', 'oil', 'oil'; 'oil', 'oil', 'oil'; ...
           'air', 'air', 'air'; 'air', 'air', 'air'; 'air', 'air', 'air'};

 [TAB, STATS] = fitlm ({brands(:),popper(:)},popcorn(:),"interactions",...
                          "CategoricalVars",[1,2],"display","on");


MODEL FORMULA (based on Wilkinson's notation):

Y ~ 1 + X1 + X2 + X1:X2

MODEL PARAMETERS (contrasts for the fixed effects)

Parameter               Estimate        SE  Lower.CI  Upper.CI        t Prob>|t|
--------------------------------------------------------------------------------
(Intercept)                 5.67     0.215       5.2      6.14    26.34    <.001
X1_1                       -1.33     0.304        -2     -0.67    -4.38    <.001
X1_2                       -2.17     0.304     -2.83      -1.5    -7.12    <.001
X2_1                        1.17     0.304     0.504      1.83     3.83     .002
X1:X2_1                   -0.333      0.43     -1.27     0.604    -0.77     .454
X1:X2_2                   -0.167      0.43      -1.1     0.771    -0.39     .705

ANOVA TABLE (Type II sums-of-squares):

Source                   Sum Sq.    d.f.    Mean Sq.  R Sq.            F  Prob>F
--------------------------------------------------------------------------------
X1                         15.75       2       7.875  0.904        56.70   <.001
X2                           4.5       1         4.5  0.730        32.40   <.001
X1*X2                   0.083333       2    0.041667  0.048         0.30    .746
Error                     1.6667      12     0.13889
Total                         22      17
|
