Categories &
Functions List
- BetaDistribution
- BinomialDistribution
- BirnbaumSaundersDistribution
- BurrDistribution
- ExponentialDistribution
- ExtremeValueDistribution
- GammaDistribution
- GeneralizedExtremeValueDistribution
- GeneralizedParetoDistribution
- HalfNormalDistribution
- InverseGaussianDistribution
- LogisticDistribution
- LoglogisticDistribution
- LognormalDistribution
- LoguniformDistribution
- MultinomialDistribution
- NakagamiDistribution
- NegativeBinomialDistribution
- NormalDistribution
- PiecewiseLinearDistribution
- PoissonDistribution
- RayleighDistribution
- RicianDistribution
- tLocationScaleDistribution
- TriangularDistribution
- UniformDistribution
- WeibullDistribution
- betafit
- betalike
- binofit
- binolike
- bisafit
- bisalike
- burrfit
- burrlike
- evfit
- evlike
- expfit
- explike
- gamfit
- gamlike
- geofit
- gevfit_lmom
- gevfit
- gevlike
- gpfit
- gplike
- gumbelfit
- gumbellike
- hnfit
- hnlike
- invgfit
- invglike
- logifit
- logilike
- loglfit
- logllike
- lognfit
- lognlike
- nakafit
- nakalike
- nbinfit
- nbinlike
- normfit
- normlike
- poissfit
- poisslike
- raylfit
- rayllike
- ricefit
- ricelike
- tlsfit
- tlslike
- unidfit
- unifit
- wblfit
- wbllike
- betacdf
- betainv
- betapdf
- betarnd
- binocdf
- binoinv
- binopdf
- binornd
- bisacdf
- bisainv
- bisapdf
- bisarnd
- burrcdf
- burrinv
- burrpdf
- burrrnd
- bvncdf
- bvtcdf
- cauchycdf
- cauchyinv
- cauchypdf
- cauchyrnd
- chi2cdf
- chi2inv
- chi2pdf
- chi2rnd
- copulacdf
- copulapdf
- copularnd
- evcdf
- evinv
- evpdf
- evrnd
- expcdf
- expinv
- exppdf
- exprnd
- fcdf
- finv
- fpdf
- frnd
- gamcdf
- gaminv
- gampdf
- gamrnd
- geocdf
- geoinv
- geopdf
- geornd
- gevcdf
- gevinv
- gevpdf
- gevrnd
- gpcdf
- gpinv
- gppdf
- gprnd
- gumbelcdf
- gumbelinv
- gumbelpdf
- gumbelrnd
- hncdf
- hninv
- hnpdf
- hnrnd
- hygecdf
- hygeinv
- hygepdf
- hygernd
- invgcdf
- invginv
- invgpdf
- invgrnd
- iwishpdf
- iwishrnd
- jsucdf
- jsupdf
- laplacecdf
- laplaceinv
- laplacepdf
- laplacernd
- logicdf
- logiinv
- logipdf
- logirnd
- loglcdf
- loglinv
- loglpdf
- loglrnd
- logncdf
- logninv
- lognpdf
- lognrnd
- mnpdf
- mnrnd
- mvncdf
- mvnpdf
- mvnrnd
- mvtcdf
- mvtpdf
- mvtrnd
- mvtcdfqmc
- nakacdf
- nakainv
- nakapdf
- nakarnd
- nbincdf
- nbininv
- nbinpdf
- nbinrnd
- ncfcdf
- ncfinv
- ncfpdf
- ncfrnd
- nctcdf
- nctinv
- nctpdf
- nctrnd
- ncx2cdf
- ncx2inv
- ncx2pdf
- ncx2rnd
- normcdf
- norminv
- normpdf
- normrnd
- plcdf
- plinv
- plpdf
- plrnd
- poisscdf
- poissinv
- poisspdf
- poissrnd
- raylcdf
- raylinv
- raylpdf
- raylrnd
- ricecdf
- riceinv
- ricepdf
- ricernd
- tcdf
- tinv
- tpdf
- trnd
- tlscdf
- tlsinv
- tlspdf
- tlsrnd
- tricdf
- triinv
- tripdf
- trirnd
- unidcdf
- unidinv
- unidpdf
- unidrnd
- unifcdf
- unifinv
- unifpdf
- unifrnd
- vmcdf
- vminv
- vmpdf
- vmrnd
- wblcdf
- wblinv
- wblpdf
- wblrnd
- wienrnd
- wishpdf
- wishrnd
- adtest
- anova
- anova1
- anova2
- anovan
- bartlett_test
- barttest
- binotest
- chi2gof
- chi2test
- correlation_test
- fishertest
- friedman
- hotelling_t2test
- hotelling_t2test2
- kruskalwallis
- kstest
- kstest2
- levene_test
- manova1
- mcnemar_test
- multcompare
- ranksum
- regression_ftest
- regression_ttest
- runstest
- sampsizepwr
- signrank
- signtest
- tiedrank
- ttest
- ttest2
- vartest
- vartest2
- vartestn
- ztest
- ztest2
Function Reference: violin
statistics: violin (x)
statistics: h = violin (x)
statistics: h = violin (…, property, value, …)
statistics: h = violin (hax, …)
statistics: h = violin (…,
"horizontal")
Produce a Violin plot of the data x.
The input data x can be a N-by-m array containing N observations of m variables. It can also be a cell with m elements, for the case in which the variables are not uniformly sampled.
The following property can be set using property/value pairs (default values in parenthesis). The value of the property can be a scalar indicating that it applies to all the variables in the data. It can also be a cell/array, indicating the property for each variable. In this case it should have m columns (as many as variables).
- Color
- ("y") Indicates the filling color of the violins.
- Nbins
- (50) Internally, the function calls
histto compute the histogram of the data. This property indicates how many bins to use. Seehelp histfor more details. - SmoothFactor
- (4) The function performs simple kernel density estimation and automatically
finds the bandwidth of the kernel function that best approximates the
histogram using optimization (
sqp). The result is in general very noisy. To smooth the result the bandwidth is multiplied by the value of this property. The higher the value the smoother the violins, but values too high might remove features from the data distribution. - Bandwidth
- (NA) If this property is given a value other than NA, it sets the bandwidth of the kernel function. No optimization is performed and the property SmoothFactor is ignored.
- Width
- (0.5) Sets the maximum width of the violins. Violins are centered at integer axis values. The distance between two violin middle axis is 1. Setting a value higher than 1 in this property will cause the violins to overlap.
If the string "Horizontal" is among the input arguments, the violin plot is rendered along the x axis with the variables in the y axis.
The returned structure h has handles to the plot elements, allowing customization of the visualization using set/get functions.
Example:
 title ("Grade 3 heights");
 axis ([0,3]);
 set (gca, "xtick", 1:2, "xticklabel", {"girls"; "boys"});
 h = violin ({randn(100,1)*5+140, randn(130,1)*8+135}, "Nbins", 10);
 set (h.violin, "linewidth", 2)
|
See also: boxplot, hist
Source Code: violin
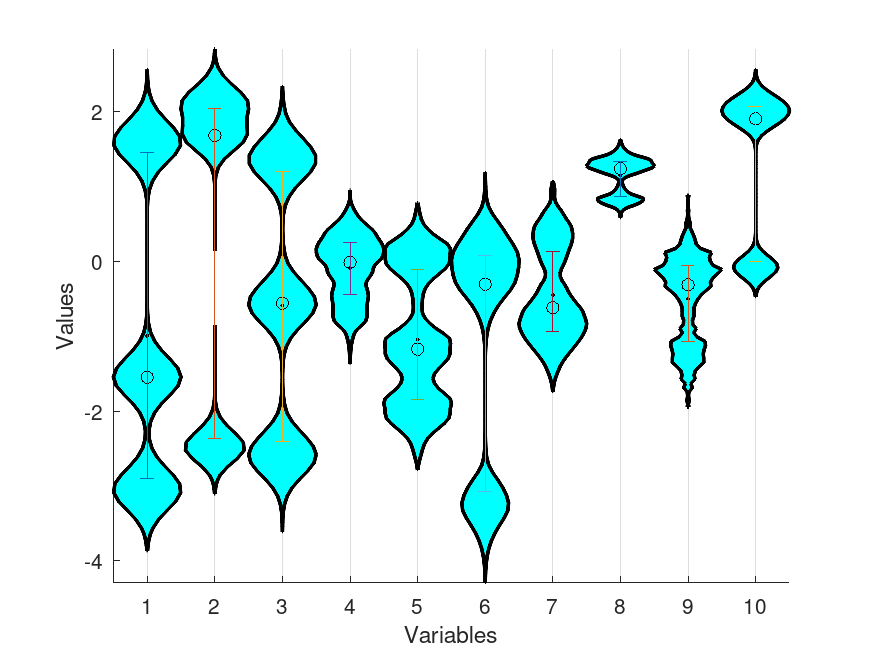
Example: 1
 clf
 x = zeros (9e2, 10);
 for i=1:10
   x(:,i) = (0.1 * randn (3e2, 3) * (randn (3,1) + 1) + 2 * randn (1,3))(:);
 endfor
 h = violin (x, 'color', 'c');
 axis tight
 set (h.violin, 'linewidth', 2);
 set (gca, 'xgrid', 'on');
 xlabel ('Variables')
 ylabel ('Values')
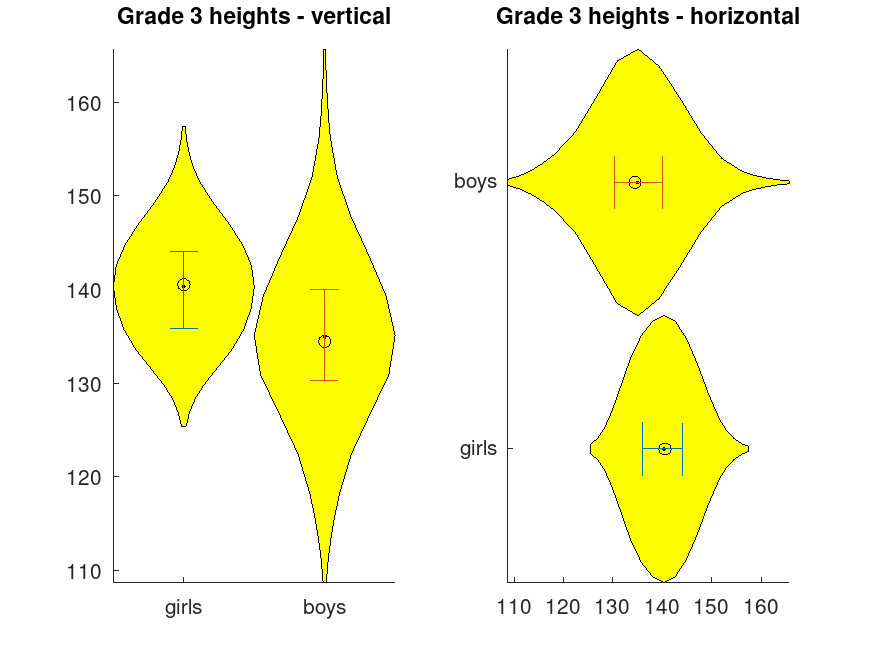
Example: 2
 clf
 data = {randn(100,1)*5+140, randn(130,1)*8+135};
 subplot (1,2,1)
 title ('Grade 3 heights - vertical');
 set (gca, 'xtick', 1:2, 'xticklabel', {'girls'; 'boys'});
 violin (data, 'Nbins', 10);
 axis tight
 subplot (1,2,2)
 title ('Grade 3 heights - horizontal');
 set (gca, 'ytick', 1:2, 'yticklabel', {'girls'; 'boys'});
 violin (data, 'horizontal', 'Nbins', 10);
 axis tight
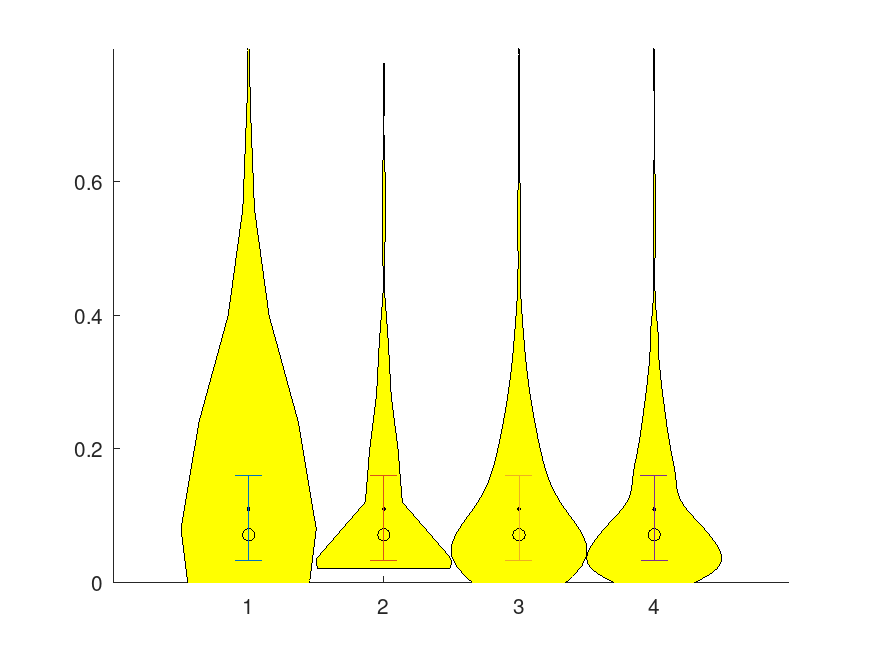
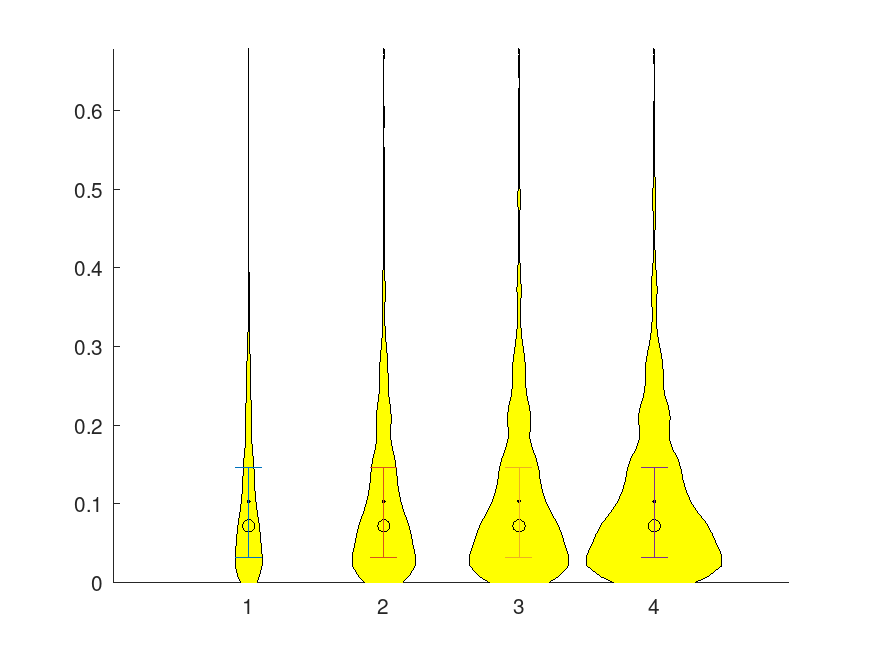
Example: 3
 clf
 data = exprnd (0.1, 500,4);
 violin (data, 'nbins', {5,10,50,100});
 axis ([0 5 0 max(data(:))])
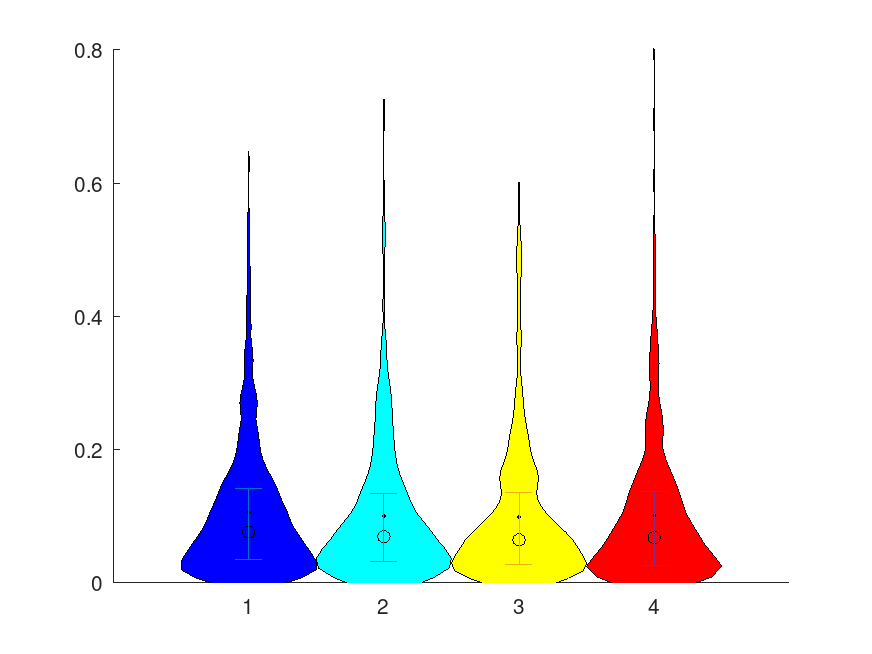
Example: 4
 clf
 data = exprnd (0.1, 500,4);
 violin (data, 'color', jet (4));
 axis ([0 5 0 max(data(:))])
Example: 5
 clf
 data = repmat (exprnd (0.1, 500,1), 1, 4);
 violin (data, 'width', linspace (0.1,0.5,4));
 axis ([0 5 0 max(data(:))])
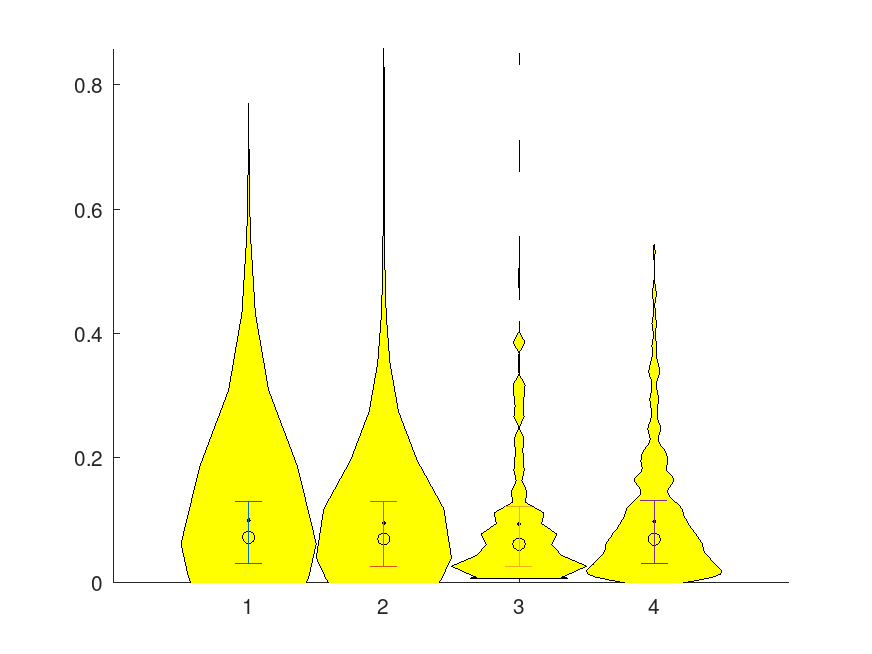
Example: 6
 clf
 data = repmat (exprnd (0.1, 500,1), 1, 4);
 violin (data, 'nbins', [5,10,50,100], 'smoothfactor', [4 4 8 10]);
 axis ([0 5 0 max(data(:))])