Categories &
Functions List
- BetaDistribution
- BinomialDistribution
- BirnbaumSaundersDistribution
- BurrDistribution
- ExponentialDistribution
- ExtremeValueDistribution
- GammaDistribution
- GeneralizedExtremeValueDistribution
- GeneralizedParetoDistribution
- HalfNormalDistribution
- InverseGaussianDistribution
- LogisticDistribution
- LoglogisticDistribution
- LognormalDistribution
- LoguniformDistribution
- MultinomialDistribution
- NakagamiDistribution
- NegativeBinomialDistribution
- NormalDistribution
- PiecewiseLinearDistribution
- PoissonDistribution
- RayleighDistribution
- RicianDistribution
- tLocationScaleDistribution
- TriangularDistribution
- UniformDistribution
- WeibullDistribution
- betafit
- betalike
- binofit
- binolike
- bisafit
- bisalike
- burrfit
- burrlike
- evfit
- evlike
- expfit
- explike
- gamfit
- gamlike
- geofit
- gevfit_lmom
- gevfit
- gevlike
- gpfit
- gplike
- gumbelfit
- gumbellike
- hnfit
- hnlike
- invgfit
- invglike
- logifit
- logilike
- loglfit
- logllike
- lognfit
- lognlike
- nakafit
- nakalike
- nbinfit
- nbinlike
- normfit
- normlike
- poissfit
- poisslike
- raylfit
- rayllike
- ricefit
- ricelike
- tlsfit
- tlslike
- unidfit
- unifit
- wblfit
- wbllike
- betacdf
- betainv
- betapdf
- betarnd
- binocdf
- binoinv
- binopdf
- binornd
- bisacdf
- bisainv
- bisapdf
- bisarnd
- burrcdf
- burrinv
- burrpdf
- burrrnd
- bvncdf
- bvtcdf
- cauchycdf
- cauchyinv
- cauchypdf
- cauchyrnd
- chi2cdf
- chi2inv
- chi2pdf
- chi2rnd
- copulacdf
- copulapdf
- copularnd
- evcdf
- evinv
- evpdf
- evrnd
- expcdf
- expinv
- exppdf
- exprnd
- fcdf
- finv
- fpdf
- frnd
- gamcdf
- gaminv
- gampdf
- gamrnd
- geocdf
- geoinv
- geopdf
- geornd
- gevcdf
- gevinv
- gevpdf
- gevrnd
- gpcdf
- gpinv
- gppdf
- gprnd
- gumbelcdf
- gumbelinv
- gumbelpdf
- gumbelrnd
- hncdf
- hninv
- hnpdf
- hnrnd
- hygecdf
- hygeinv
- hygepdf
- hygernd
- invgcdf
- invginv
- invgpdf
- invgrnd
- iwishpdf
- iwishrnd
- jsucdf
- jsupdf
- laplacecdf
- laplaceinv
- laplacepdf
- laplacernd
- logicdf
- logiinv
- logipdf
- logirnd
- loglcdf
- loglinv
- loglpdf
- loglrnd
- logncdf
- logninv
- lognpdf
- lognrnd
- mnpdf
- mnrnd
- mvncdf
- mvnpdf
- mvnrnd
- mvtcdf
- mvtpdf
- mvtrnd
- mvtcdfqmc
- nakacdf
- nakainv
- nakapdf
- nakarnd
- nbincdf
- nbininv
- nbinpdf
- nbinrnd
- ncfcdf
- ncfinv
- ncfpdf
- ncfrnd
- nctcdf
- nctinv
- nctpdf
- nctrnd
- ncx2cdf
- ncx2inv
- ncx2pdf
- ncx2rnd
- normcdf
- norminv
- normpdf
- normrnd
- plcdf
- plinv
- plpdf
- plrnd
- poisscdf
- poissinv
- poisspdf
- poissrnd
- raylcdf
- raylinv
- raylpdf
- raylrnd
- ricecdf
- riceinv
- ricepdf
- ricernd
- tcdf
- tinv
- tpdf
- trnd
- tlscdf
- tlsinv
- tlspdf
- tlsrnd
- tricdf
- triinv
- tripdf
- trirnd
- unidcdf
- unidinv
- unidpdf
- unidrnd
- unifcdf
- unifinv
- unifpdf
- unifrnd
- vmcdf
- vminv
- vmpdf
- vmrnd
- wblcdf
- wblinv
- wblpdf
- wblrnd
- wienrnd
- wishpdf
- wishrnd
- adtest
- anova1
- anova2
- anovan
- bartlett_test
- barttest
- binotest
- chi2gof
- chi2test
- correlation_test
- fishertest
- friedman
- hotelling_t2test
- hotelling_t2test2
- kruskalwallis
- kstest
- kstest2
- levene_test
- manova1
- mcnemar_test
- multcompare
- ranksum
- regression_ftest
- regression_ttest
- runstest
- sampsizepwr
- signrank
- signtest
- tiedrank
- ttest
- ttest2
- vartest
- vartest2
- vartestn
- ztest
- ztest2
Function Reference: bar3
statistics: bar3 (z)
statistics: bar3 (y, z)
statistics: bar3 (…, width)
statistics: bar3 (…, style)
statistics: bar3 (…, color)
statistics: bar3 (…, name, value)
statistics: bar3 (ax, …)
statistics: p = bar3 (…)
Plot a 3D bar graph.
bar3 (z) plots 3D bar graph for the elements of z. Each
bar corresponds to an element in z, which can be a scalar, vector, or
2D matrix. By default, each column in z is considered as a series and
it is handled as a distinct series of bars. When z is a vector, unlike
MATLAB, which plots it as a single series of bars, Octave discriminates
between a row and column vector of z. Hence, when z is column
vector, it is plotted as a single series of bars (same color), whereas when
z is row vector, each bar is plotted as a different group (different
colors). For an matrix, the function plots the bars corresponding
to each row on the y-axis ranging from to and each
column on the x-axis ranging from to .
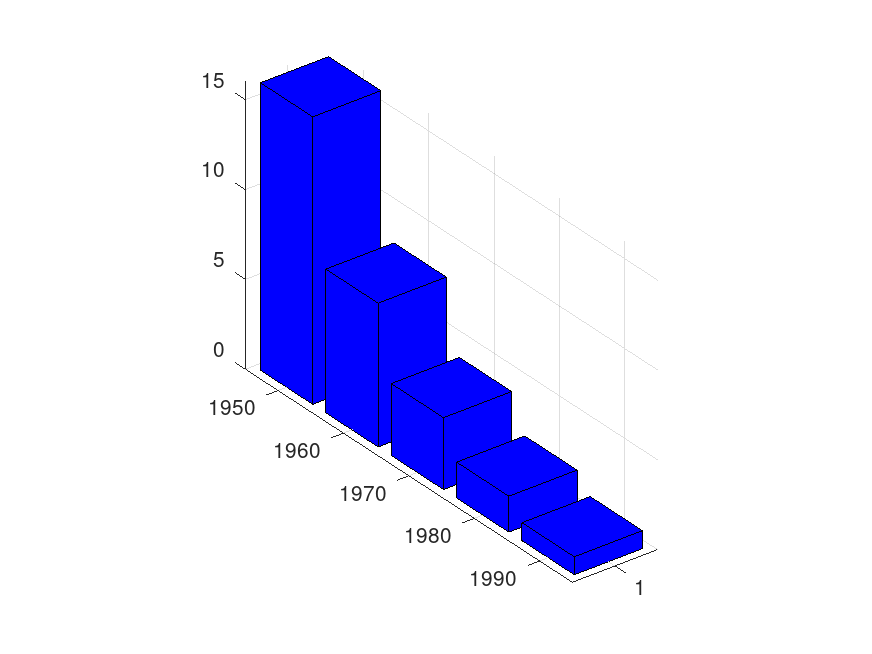
bar3 (y, z) plots a 3D bar graph of the elements in
z at the y-values specified in y. It should be noted
that y only affects the tick names along the y-axis rather the
actual values. If you want to specify non-numerical values for y, you
can specify it with the paired name/value syntax shown below.
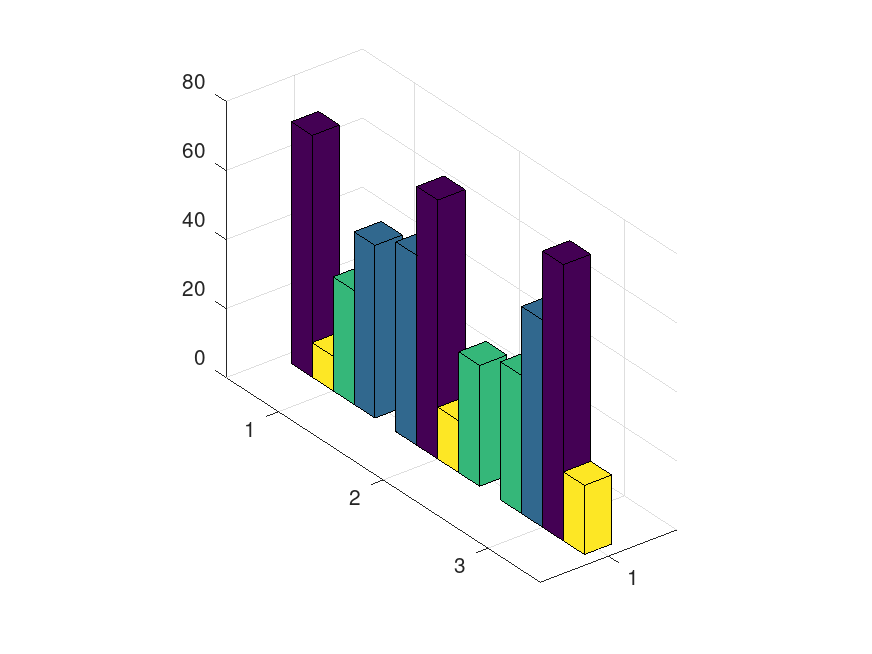
bar3 (…, width) sets the width of the bars along the
x- and y-axes and controls the separation of bars among each
other. width can take any value in the range . By default,
width is 0.8 and the bars have a small separation. If width is 1, the
bars touch one another. Alternatively, you can define width as a two-
element vector using the paired name/value syntax shown below, in
which case you can control the bar separation along each axis independently.
bar3 (…, style) specifies the style of the bars, where
style can be 'detached', 'grouped', or
'stacked'. The default style is @code {’detached’.
bar3 (…, color) displays all bars using the color specified
by color. For example, use 'red' or 'r' to specify all red
bars. When you want to specify colors for several groups, color can be
a cellstr vector with each element specifying the color of each group.
color can also be specified as a numerical matrix, where
each row corresponds to a RGB value with its elements in the range
. If only one color is specified, then it applies to all bars.
If the number of colors equals the number of groups, then each color is
applied to each group. If the number of colors equals the number of elements
in z, then each individual bar is assigned the particular color. You
can also define color using the paired name/value syntax
shown below.
bar3 (…, name, value) specifies one or more of the
following name/value pairs:
| Name | Value | |
|---|---|---|
"width" | A two-element vector specifying the width
of the bars along the x- and y-axes, respectively. Each
element must be in the range . | |
"color" | A character or a cellstr vector, or a numerical matrix following the same conventions as the color input argument. | |
"xlabel" | A cellstr vector specifying the group names
along the x-axis. | |
"ylabel" | A cellstr vector specifying the names of the
bars in the same series along the y-axis. |
bar3 (ax, …) can also take an axes handle ax as a
first argument in which case it plots into the axes specified by ax
instead of into the current axes specified by gca (). The optional
argument ax can precede any of the input argument combinations in the
previous syntaxes.
p = bar3 (…) returns a patch handle p, which can be
used to set properties of the bars after displaying the 3D bar graph.
Source Code: bar3
Example: 1
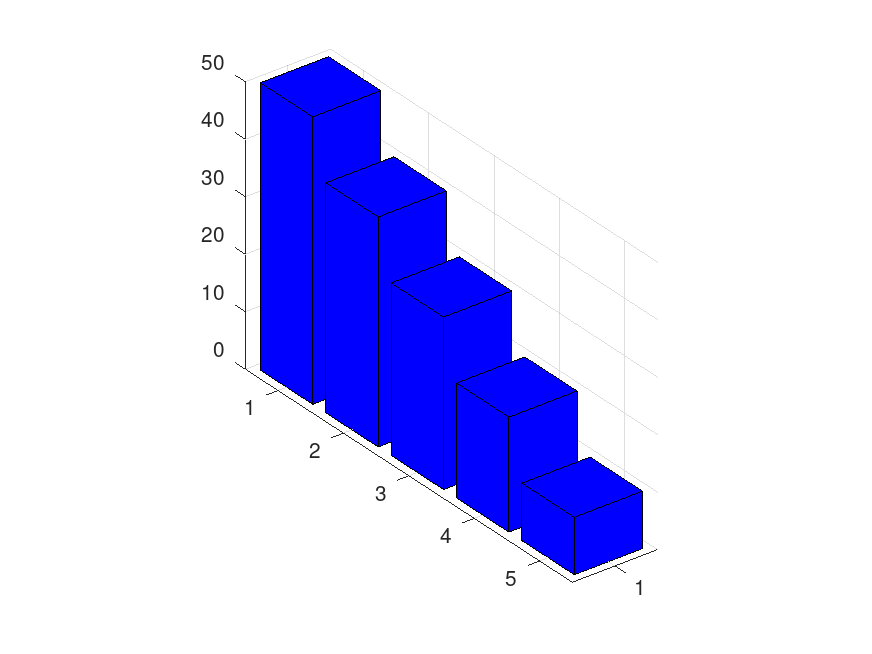
 ## Plotting 5 bars in the same series.

 z = [50; 40; 30; 20; 10];
 bar3 (z);
|
Example: 2
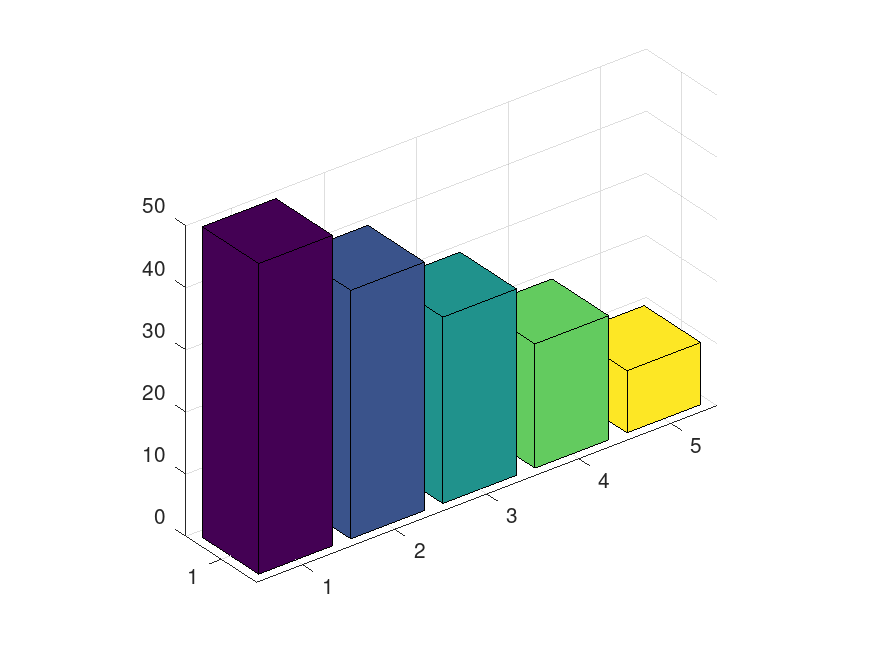
 ## Plotting 5 bars in different groups.

 z = [50, 40, 30, 20, 10];
 bar3 (z);
|
Example: 3
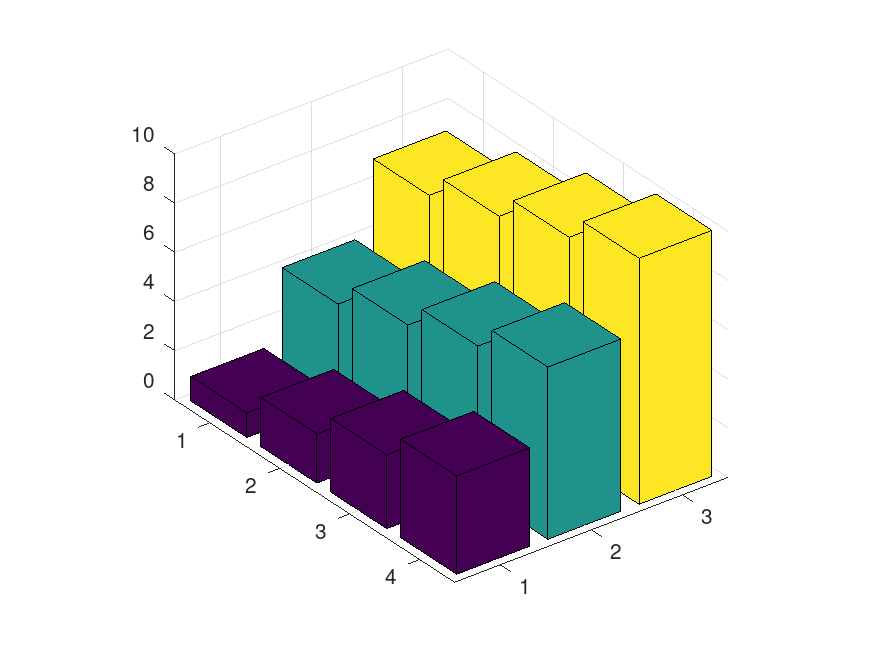
 ## A 3D bar graph with each series corresponding to a column in z.

 z = [1, 4, 7; 2, 5, 8; 3, 6, 9; 4, 7, 10];
 bar3 (z);
|
Example: 4
 ## Specify y-axis locations as tick names. y must be a column vector!

 y = [1950, 1960, 1970, 1980, 1990]';
 z = [16, 8, 4, 2, 1]';
 bar3 (y, z);
|
Example: 5
 ## Plot 3 series as a grouped plot without any space between the grouped bars

 z = [70 50 33 10; 75 55 35 15; 80 60 40 20];
 bar3 (z, 1, 'grouped');
|
Example: 6
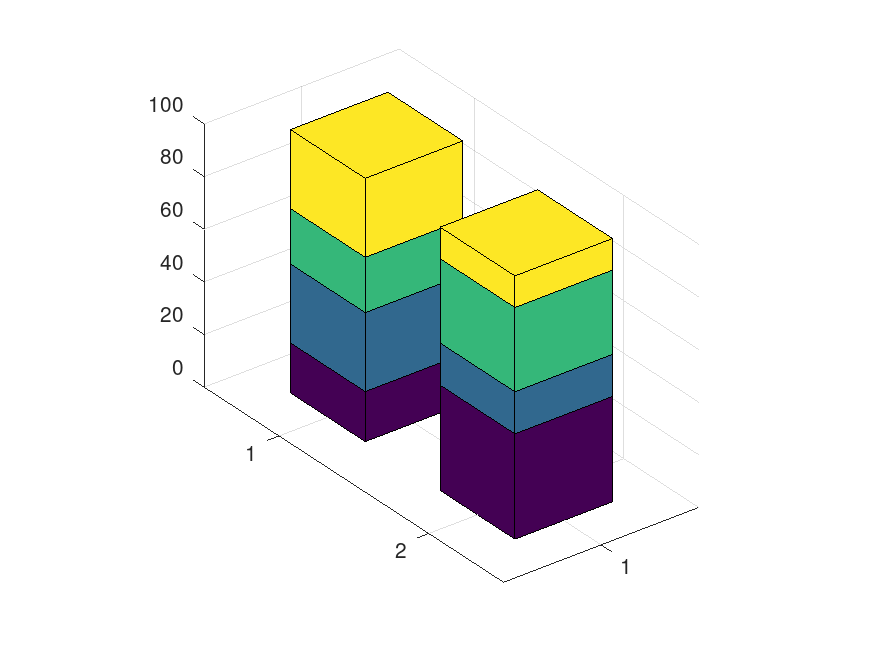
 ## Plot a stacked style 3D bar graph

 z = [19, 30, 21, 30; 40, 16, 32, 12];
 b = bar3 (z, 0.5, 'stacked');
|
