Categories &
Functions List
- BetaDistribution
- BinomialDistribution
- BirnbaumSaundersDistribution
- BurrDistribution
- ExponentialDistribution
- ExtremeValueDistribution
- GammaDistribution
- GeneralizedExtremeValueDistribution
- GeneralizedParetoDistribution
- HalfNormalDistribution
- InverseGaussianDistribution
- LogisticDistribution
- LoglogisticDistribution
- LognormalDistribution
- LoguniformDistribution
- MultinomialDistribution
- NakagamiDistribution
- NegativeBinomialDistribution
- NormalDistribution
- PiecewiseLinearDistribution
- PoissonDistribution
- RayleighDistribution
- RicianDistribution
- tLocationScaleDistribution
- TriangularDistribution
- UniformDistribution
- WeibullDistribution
- betafit
- betalike
- binofit
- binolike
- bisafit
- bisalike
- burrfit
- burrlike
- evfit
- evlike
- expfit
- explike
- gamfit
- gamlike
- geofit
- gevfit_lmom
- gevfit
- gevlike
- gpfit
- gplike
- gumbelfit
- gumbellike
- hnfit
- hnlike
- invgfit
- invglike
- logifit
- logilike
- loglfit
- logllike
- lognfit
- lognlike
- nakafit
- nakalike
- nbinfit
- nbinlike
- normfit
- normlike
- poissfit
- poisslike
- raylfit
- rayllike
- ricefit
- ricelike
- tlsfit
- tlslike
- unidfit
- unifit
- wblfit
- wbllike
- betacdf
- betainv
- betapdf
- betarnd
- binocdf
- binoinv
- binopdf
- binornd
- bisacdf
- bisainv
- bisapdf
- bisarnd
- burrcdf
- burrinv
- burrpdf
- burrrnd
- bvncdf
- bvtcdf
- cauchycdf
- cauchyinv
- cauchypdf
- cauchyrnd
- chi2cdf
- chi2inv
- chi2pdf
- chi2rnd
- copulacdf
- copulapdf
- copularnd
- evcdf
- evinv
- evpdf
- evrnd
- expcdf
- expinv
- exppdf
- exprnd
- fcdf
- finv
- fpdf
- frnd
- gamcdf
- gaminv
- gampdf
- gamrnd
- geocdf
- geoinv
- geopdf
- geornd
- gevcdf
- gevinv
- gevpdf
- gevrnd
- gpcdf
- gpinv
- gppdf
- gprnd
- gumbelcdf
- gumbelinv
- gumbelpdf
- gumbelrnd
- hncdf
- hninv
- hnpdf
- hnrnd
- hygecdf
- hygeinv
- hygepdf
- hygernd
- invgcdf
- invginv
- invgpdf
- invgrnd
- iwishpdf
- iwishrnd
- jsucdf
- jsupdf
- laplacecdf
- laplaceinv
- laplacepdf
- laplacernd
- logicdf
- logiinv
- logipdf
- logirnd
- loglcdf
- loglinv
- loglpdf
- loglrnd
- logncdf
- logninv
- lognpdf
- lognrnd
- mnpdf
- mnrnd
- mvncdf
- mvnpdf
- mvnrnd
- mvtcdf
- mvtpdf
- mvtrnd
- mvtcdfqmc
- nakacdf
- nakainv
- nakapdf
- nakarnd
- nbincdf
- nbininv
- nbinpdf
- nbinrnd
- ncfcdf
- ncfinv
- ncfpdf
- ncfrnd
- nctcdf
- nctinv
- nctpdf
- nctrnd
- ncx2cdf
- ncx2inv
- ncx2pdf
- ncx2rnd
- normcdf
- norminv
- normpdf
- normrnd
- plcdf
- plinv
- plpdf
- plrnd
- poisscdf
- poissinv
- poisspdf
- poissrnd
- raylcdf
- raylinv
- raylpdf
- raylrnd
- ricecdf
- riceinv
- ricepdf
- ricernd
- tcdf
- tinv
- tpdf
- trnd
- tlscdf
- tlsinv
- tlspdf
- tlsrnd
- tricdf
- triinv
- tripdf
- trirnd
- unidcdf
- unidinv
- unidpdf
- unidrnd
- unifcdf
- unifinv
- unifpdf
- unifrnd
- vmcdf
- vminv
- vmpdf
- vmrnd
- wblcdf
- wblinv
- wblpdf
- wblrnd
- wienrnd
- wishpdf
- wishrnd
- adtest
- anova
- anova1
- anova2
- anovan
- bartlett_test
- barttest
- binotest
- chi2gof
- chi2test
- correlation_test
- fishertest
- friedman
- hotelling_t2test
- hotelling_t2test2
- kruskalwallis
- kstest
- kstest2
- levene_test
- manova1
- mcnemar_test
- multcompare
- ranksum
- regression_ftest
- regression_ttest
- runstest
- sampsizepwr
- signrank
- signtest
- tiedrank
- ttest
- ttest2
- vartest
- vartest2
- vartestn
- ztest
- ztest2
Function Reference: nbinpdf
statistics: y = nbinpdf (x, r, ps)
Negative binomial probability density function (PDF).
For each element of x, compute the probability density function (PDF) at x of the negative binomial distribution with parameters r and ps, where r is the number of successes until the experiment is stopped and ps is the probability of success in each experiment, given the number of failures in x. The size of y is the common size of x, r, and ps. A scalar input functions as a constant matrix of the same size as the other inputs.
When r is an integer, the negative binomial distribution is also known
as the Pascal distribution and it models the number of failures in x
before a specified number of successes is reached in a series of independent,
identical trials. Its parameters are the probability of success in a single
trial, ps, and the number of successes, r. A special case of the
negative binomial distribution, when r = 1, is the geometric
distribution, which models the number of failures before the first success.
r can also have non-integer positive values, in which form the negative binomial distribution, also known as the Polya distribution, has no interpretation in terms of repeated trials, but, like the Poisson distribution, it is useful in modeling count data. The negative binomial distribution is more general than the Poisson distribution because it has a variance that is greater than its mean, making it suitable for count data that do not meet the assumptions of the Poisson distribution. In the limit, as r increases to infinity, the negative binomial distribution approaches the Poisson distribution.
Further information about the negative binomial distribution can be found at https://en.wikipedia.org/wiki/Negative_binomial_distribution
See also: nbininv, nbininv, nbinrnd, nbinfit, nbinlike, nbinstat
Source Code: nbinpdf
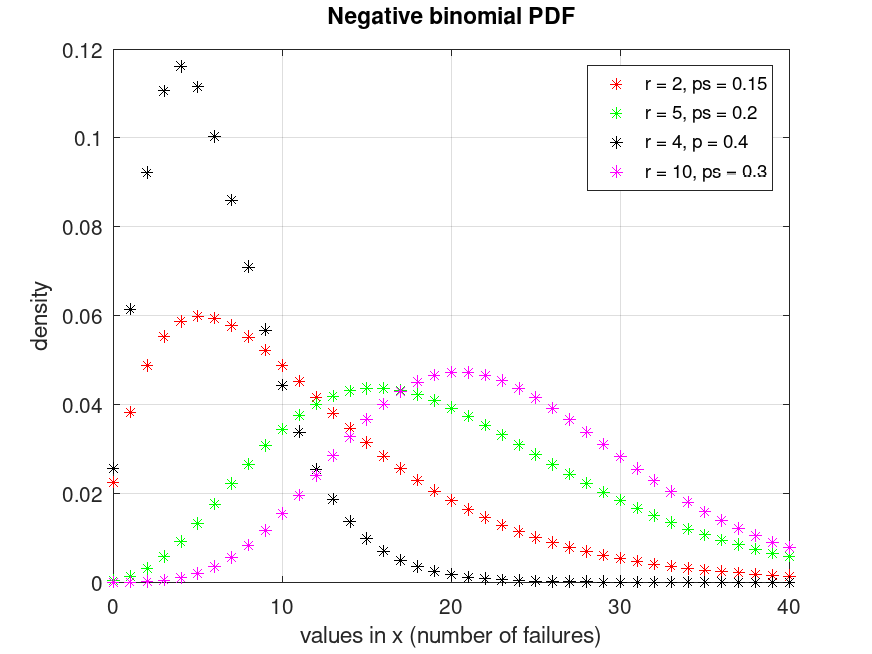
Example: 1
Plot various PDFs from the negative binomial distribution
 x = 0:40;
 y1 = nbinpdf (x, 2, 0.15);
 y2 = nbinpdf (x, 5, 0.2);
 y3 = nbinpdf (x, 4, 0.4);
 y4 = nbinpdf (x, 10, 0.3);
 plot (x, y1, '*r', x, y2, '*g', x, y3, '*k', x, y4, '*m')
 grid on
 xlim ([0, 40])
 ylim ([0, 0.12])
 legend ({'r = 2, ps = 0.15', 'r = 5, ps = 0.2', 'r = 4, p = 0.4', ...
          'r = 10, ps = 0.3'}, 'location', 'northeast')
 title ('Negative binomial PDF')
 xlabel ('values in x (number of failures)')
 ylabel ('density')