Categories &
Functions List
- BetaDistribution
- BinomialDistribution
- BirnbaumSaundersDistribution
- BurrDistribution
- ExponentialDistribution
- ExtremeValueDistribution
- GammaDistribution
- GeneralizedExtremeValueDistribution
- GeneralizedParetoDistribution
- HalfNormalDistribution
- InverseGaussianDistribution
- LogisticDistribution
- LoglogisticDistribution
- LognormalDistribution
- LoguniformDistribution
- MultinomialDistribution
- NakagamiDistribution
- NegativeBinomialDistribution
- NormalDistribution
- PiecewiseLinearDistribution
- PoissonDistribution
- RayleighDistribution
- RicianDistribution
- tLocationScaleDistribution
- TriangularDistribution
- UniformDistribution
- WeibullDistribution
- betafit
- betalike
- binofit
- binolike
- bisafit
- bisalike
- burrfit
- burrlike
- evfit
- evlike
- expfit
- explike
- gamfit
- gamlike
- geofit
- gevfit_lmom
- gevfit
- gevlike
- gpfit
- gplike
- gumbelfit
- gumbellike
- hnfit
- hnlike
- invgfit
- invglike
- logifit
- logilike
- loglfit
- logllike
- lognfit
- lognlike
- nakafit
- nakalike
- nbinfit
- nbinlike
- normfit
- normlike
- poissfit
- poisslike
- raylfit
- rayllike
- ricefit
- ricelike
- tlsfit
- tlslike
- unidfit
- unifit
- wblfit
- wbllike
- betacdf
- betainv
- betapdf
- betarnd
- binocdf
- binoinv
- binopdf
- binornd
- bisacdf
- bisainv
- bisapdf
- bisarnd
- burrcdf
- burrinv
- burrpdf
- burrrnd
- bvncdf
- bvtcdf
- cauchycdf
- cauchyinv
- cauchypdf
- cauchyrnd
- chi2cdf
- chi2inv
- chi2pdf
- chi2rnd
- copulacdf
- copulapdf
- copularnd
- evcdf
- evinv
- evpdf
- evrnd
- expcdf
- expinv
- exppdf
- exprnd
- fcdf
- finv
- fpdf
- frnd
- gamcdf
- gaminv
- gampdf
- gamrnd
- geocdf
- geoinv
- geopdf
- geornd
- gevcdf
- gevinv
- gevpdf
- gevrnd
- gpcdf
- gpinv
- gppdf
- gprnd
- gumbelcdf
- gumbelinv
- gumbelpdf
- gumbelrnd
- hncdf
- hninv
- hnpdf
- hnrnd
- hygecdf
- hygeinv
- hygepdf
- hygernd
- invgcdf
- invginv
- invgpdf
- invgrnd
- iwishpdf
- iwishrnd
- jsucdf
- jsupdf
- laplacecdf
- laplaceinv
- laplacepdf
- laplacernd
- logicdf
- logiinv
- logipdf
- logirnd
- loglcdf
- loglinv
- loglpdf
- loglrnd
- logncdf
- logninv
- lognpdf
- lognrnd
- mnpdf
- mnrnd
- mvncdf
- mvnpdf
- mvnrnd
- mvtcdf
- mvtpdf
- mvtrnd
- mvtcdfqmc
- nakacdf
- nakainv
- nakapdf
- nakarnd
- nbincdf
- nbininv
- nbinpdf
- nbinrnd
- ncfcdf
- ncfinv
- ncfpdf
- ncfrnd
- nctcdf
- nctinv
- nctpdf
- nctrnd
- ncx2cdf
- ncx2inv
- ncx2pdf
- ncx2rnd
- normcdf
- norminv
- normpdf
- normrnd
- plcdf
- plinv
- plpdf
- plrnd
- poisscdf
- poissinv
- poisspdf
- poissrnd
- raylcdf
- raylinv
- raylpdf
- raylrnd
- ricecdf
- riceinv
- ricepdf
- ricernd
- tcdf
- tinv
- tpdf
- trnd
- tlscdf
- tlsinv
- tlspdf
- tlsrnd
- tricdf
- triinv
- tripdf
- trirnd
- unidcdf
- unidinv
- unidpdf
- unidrnd
- unifcdf
- unifinv
- unifpdf
- unifrnd
- vmcdf
- vminv
- vmpdf
- vmrnd
- wblcdf
- wblinv
- wblpdf
- wblrnd
- wienrnd
- wishpdf
- wishrnd
- adtest
- anova
- anova1
- anova2
- anovan
- bartlett_test
- barttest
- binotest
- chi2gof
- chi2test
- correlation_test
- fishertest
- friedman
- hotelling_t2test
- hotelling_t2test2
- kruskalwallis
- kstest
- kstest2
- levene_test
- manova1
- mcnemar_test
- multcompare
- ranksum
- regression_ftest
- regression_ttest
- runstest
- sampsizepwr
- signrank
- signtest
- tiedrank
- ttest
- ttest2
- vartest
- vartest2
- vartestn
- ztest
- ztest2
Function Reference: grpstats
statistics: stats = grpstats (x)
statistics: stats = grpstats (x, group)
statistics: [stats1, …, statsN] = grpstats (x, group, whichstats)
statistics: [stats1, …, statsN] = grpstats (x, group, whichstats,
'Alpha', alpha)statistics: tblstats = grpstats (tbl, groupvars)
statistics: tblstats = grpstats (tbl, groupvars, whichstats)
statistics: tblstats = grpstats (tbl, groupvars, whichstats, Name, Value)
statistics: grpstats (x, group, alpha)
statistics: h = grpstats (x, group, alpha)
Summary statistics by group.
grpstats computes groupwise summary statistics for the data in
x, which can be a numeric matrix or a table. Numeric vectors are
treated as a single column matrix. NaNs are treated as missing
values and removed from calculations.
Syntax for Numeric Input
stats = grpstats (x) calculates the mean statistic for
each column in x and returns it as row vector in stats.
stats = grpstats (x, group) calculates the mean
statistic for each column in x grouped by group. The returned
argument, stats, is also a matrix with equal columns as x and the
number of rows is equal to the groups specified by group.
The grouping variable, group can be a vector of any data type
supported by the grp2idx function. Alternatively, it can be a cell
vector specifying multiple grouping variables with each cell element
containing any of the aforementioned supported grouping vectors. If
group is empty ([]), then input x is treated as a single
group.
[stats1, …, statsN] = grpstats (x, group,
 whichstats)
calculates the summary statistics specified by the
whichstats argument, which can include any of the available statistics
shown below. The number of output arguments must match the number of
requested statistics specified in whichstats.
computes summary statistics for the numeric matrix x grouped by
group.
x must be a numeric vector or a 2-D matrix. Vectors are treated as a single-column matrix.
group is a grouping variable that defines the groups for the rows of
x. It can be a categorical variable, numeric vector, string array, or
cell array of strings. group can also be a cell array containing
multiple grouping variables. If group is empty ([]) or omitted,
all of x is treated as a single group.
whichstats specifies the statistics to compute. It can be either a
string array or a cell array of strings specifying any of the following
builtin statistics. If omitted, the default is 'mean'.
whichstats can also contain function handles for custom statistics.
The available statistics are:
'mean' | Mean of each group. | |
'median' | Median of each group. | |
'sem' | Standard error of the mean for each group. | |
'std' | Standard deviation of each group. | |
'var' | Variance of each group. | |
'min' | Minimum value in each group. | |
'max' | Maximum value in each group. | |
'range' | Difference between max and min in each group. | |
'numel' | Number of elements (count) in each group. | |
'meanci' | Confidence interval for the mean. | |
'predci' | Prediction interval for a new observation. | |
'gname' | Group names. |
[…] = grpstats (…, specifies
the significance level for the confidence intervals ('Alpha', alpha)'meanci' and
'predci') as 100 * (1-alpha)@%. alpha must be a
scalar between 0 and 1. When not specified, it defaults to 0.05. Note that
this paired input argument is also valid for table input.
Syntax for Table Input
tblstats = grpstats (tbl, groupvars) computes the
summary statistics for the data in table tbl, grouped by the variables
specified in groupvars. If groupvars is empty or omitted, then
all of tbl is treated as a single group. groupvars can be a cell
array of character vectors or a string array specifying one or more variable
names in tbl to be used as grouping variables. Alternatively, all
valid methods for indexing table variables are supported (e.g. vartype
object, logical vector, function handle).
The output tblstats is a table with one row for each group. It contains
the grouping variables, an additional 'GroupCount' variable, and the
specified summary statistics for the variables in tbl, expect for those
specified as grouping variables. When input is a table, only a single output
variable, tblstats can be specified. The output tblstats also
contains RowNames, which are the unique combinations of the specified
groups, for which data are available in tbl. When no groups are
specified, the row name of the single row output table defaults to
'All'.
tblstats = grpstats (tbl, groupvars,
 whichstats)
specifies which statistics to calculate for the variables
in tbl. Unless specified, the mean is calculated for each variable.
When specifying more than one statistic, tblstats contains multiple
variables for each variable in tbl and each is named by combining the
applied statistic with the name of the original variable. When a function
handle is applied, its string representation is used instead.
For table input specifically, grpstats also accepts the following
paired arguments.
| Name | Value | |
|---|---|---|
'DataVars' | A vector specifying the variables in tbl, for which to calculate the specified statistics. The vector can be any of the valid options for indexing table variables. | |
'VarNames' | A cell array of character vectors or a string array specifying the names of the variables in the output table. The number of specified names must match the number of expected variables in the output table. |
Plotting Syntax
The syntax grpstats (x, group, alpha) generates an
errorbar plot with the group means and their respective confidence
intervals. x must be a numeric vector or matrix. alpha is a
scalar between 0 and 1 that determines the confidence level. This syntax is
an alternative to calling errorbar after computing 'mean' and
'meanci' statistics. The optional output h is a handle to the
hggroup object representing the data plot and errorbars.
See also: grp2idx
Source Code: grpstats
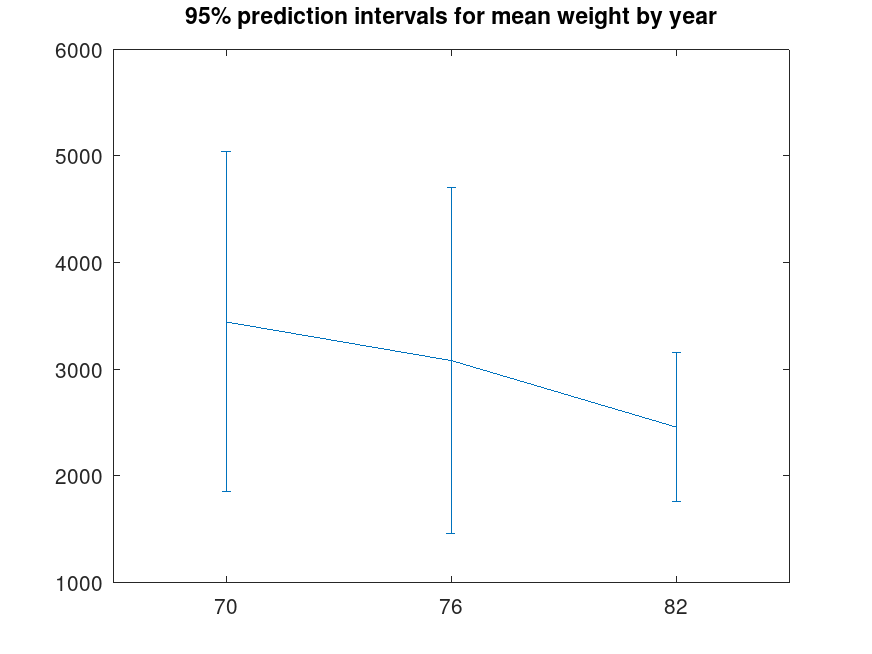
Example: 1
 load carsmall;
 [m, p, g] = grpstats (Weight, Model_Year, {'mean', 'predci', 'gname'})
m =

   3441.3
   3078.7
   2453.5

p =

   1777.0   5105.6
   1383.2   4774.2
   1718.4   3188.7

g =
  3x1 cell array

    {'70'}
    {'76'}
    {'82'}
 n = length (m);
 errorbar ((1:n)',m,p(:,2)-m);
 set (gca, 'xtick', 1:n, 'xticklabel', g);
 title ('95% prediction intervals for mean weight by year');
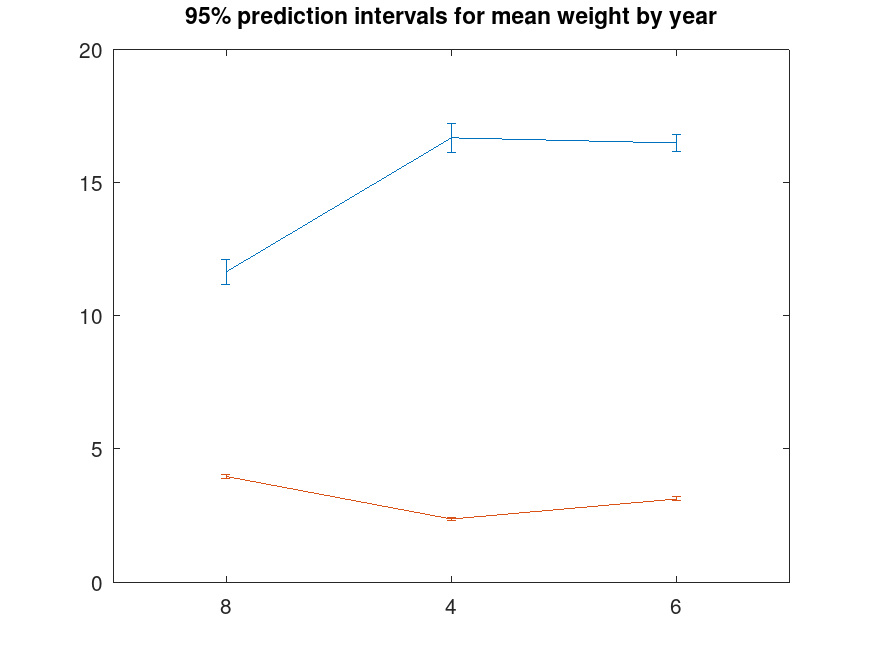
Example: 2
 load carsmall;
 [m, p, g] = grpstats ([Acceleration,Weight/1000],Cylinders, ...
                       {'mean', 'meanci', 'gname'}, 0.05)
m =

   16.6706    2.3726
   16.4765    3.1255
   11.6406    3.9703

p =

ans(:,:,1) =

   15.9163    2.2694
   15.6622    2.9345
   10.7968    3.8243

ans(:,:,2) =

   17.4249    2.4757
   17.2907    3.3164
   12.4845    4.1162

g =
  3x1 cell array

    {'4'}
    {'6'}
    {'8'}
 [c, r] = size (m);
 errorbar ((1:c)'.*ones (c,r),m,p(:,[(1:r)])-m);
 set (gca, 'xtick', 1:c, 'xticklabel', g);
 title ('95% prediction intervals for mean weight by year');
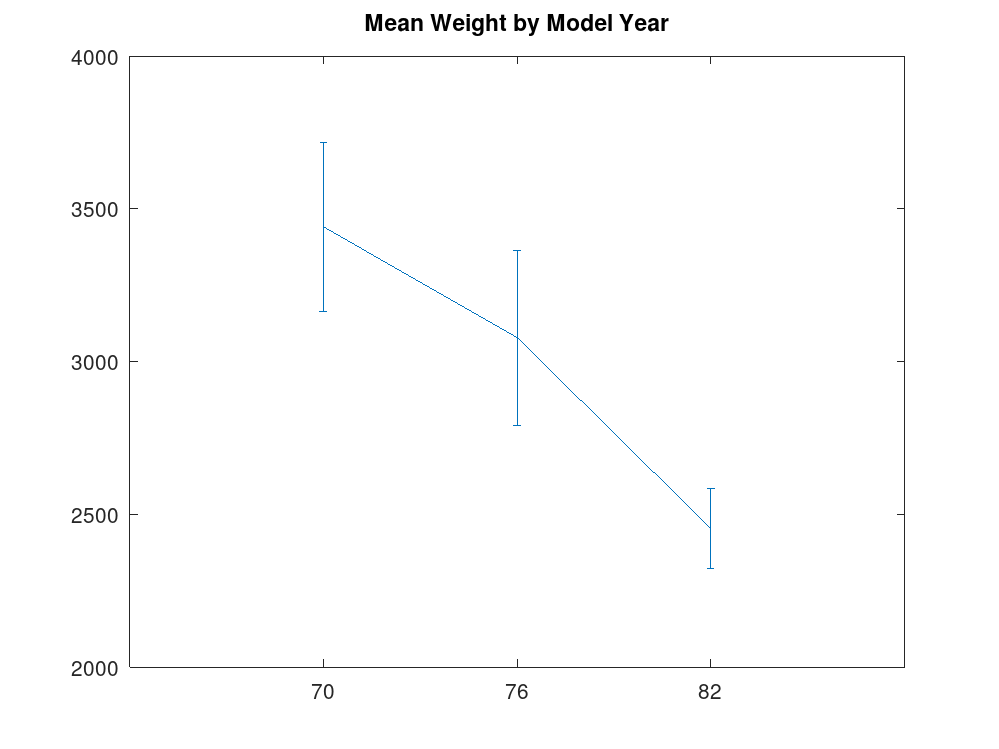
Example: 3
Plot mean and 95% CI for a single grouping variable
 load carsmall;
 grpstats (Weight, Model_Year, 0.05);
 title ('Mean Weight by Model Year');
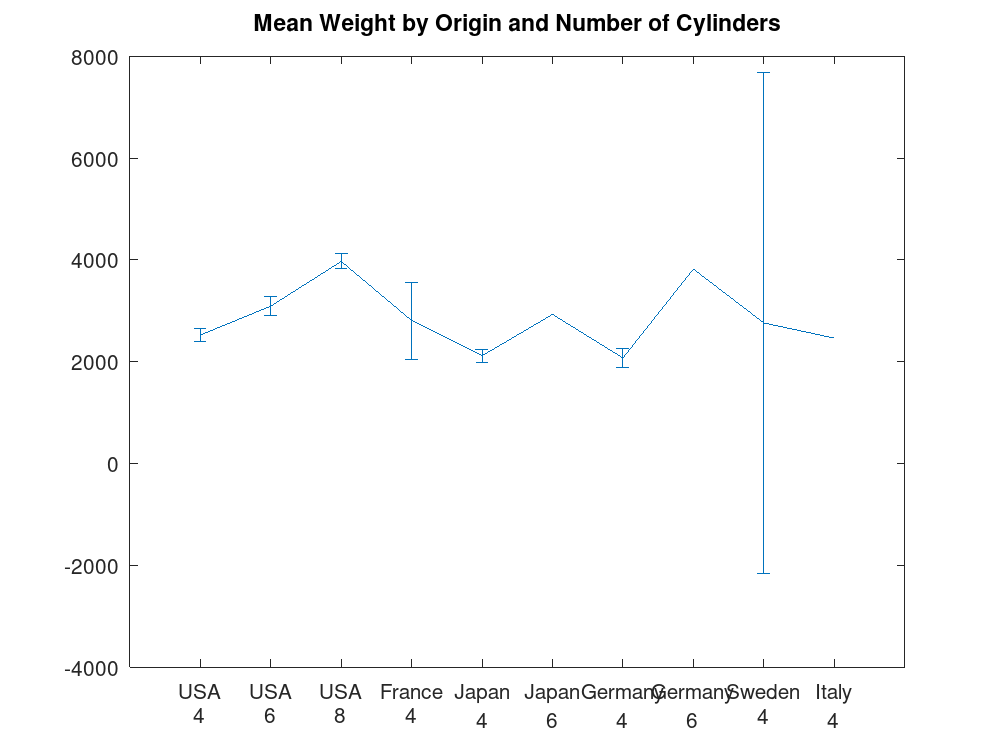
Example: 4
Plot mean and 95% CI for two grouping variables
 load carsmall;
 grpstats (Weight, {Origin, Cylinders}, 0.05);
 title ('Mean Weight by Origin and Number of Cylinders');