Categories &
Functions List
- BetaDistribution
- BinomialDistribution
- BirnbaumSaundersDistribution
- BurrDistribution
- ExponentialDistribution
- ExtremeValueDistribution
- GammaDistribution
- GeneralizedExtremeValueDistribution
- GeneralizedParetoDistribution
- HalfNormalDistribution
- InverseGaussianDistribution
- LogisticDistribution
- LoglogisticDistribution
- LognormalDistribution
- LoguniformDistribution
- MultinomialDistribution
- NakagamiDistribution
- NegativeBinomialDistribution
- NormalDistribution
- PiecewiseLinearDistribution
- PoissonDistribution
- RayleighDistribution
- RicianDistribution
- tLocationScaleDistribution
- TriangularDistribution
- UniformDistribution
- WeibullDistribution
- betafit
- betalike
- binofit
- binolike
- bisafit
- bisalike
- burrfit
- burrlike
- evfit
- evlike
- expfit
- explike
- gamfit
- gamlike
- geofit
- gevfit_lmom
- gevfit
- gevlike
- gpfit
- gplike
- gumbelfit
- gumbellike
- hnfit
- hnlike
- invgfit
- invglike
- logifit
- logilike
- loglfit
- logllike
- lognfit
- lognlike
- nakafit
- nakalike
- nbinfit
- nbinlike
- normfit
- normlike
- poissfit
- poisslike
- raylfit
- rayllike
- ricefit
- ricelike
- tlsfit
- tlslike
- unidfit
- unifit
- wblfit
- wbllike
- betacdf
- betainv
- betapdf
- betarnd
- binocdf
- binoinv
- binopdf
- binornd
- bisacdf
- bisainv
- bisapdf
- bisarnd
- burrcdf
- burrinv
- burrpdf
- burrrnd
- bvncdf
- bvtcdf
- cauchycdf
- cauchyinv
- cauchypdf
- cauchyrnd
- chi2cdf
- chi2inv
- chi2pdf
- chi2rnd
- copulacdf
- copulapdf
- copularnd
- evcdf
- evinv
- evpdf
- evrnd
- expcdf
- expinv
- exppdf
- exprnd
- fcdf
- finv
- fpdf
- frnd
- gamcdf
- gaminv
- gampdf
- gamrnd
- geocdf
- geoinv
- geopdf
- geornd
- gevcdf
- gevinv
- gevpdf
- gevrnd
- gpcdf
- gpinv
- gppdf
- gprnd
- gumbelcdf
- gumbelinv
- gumbelpdf
- gumbelrnd
- hncdf
- hninv
- hnpdf
- hnrnd
- hygecdf
- hygeinv
- hygepdf
- hygernd
- invgcdf
- invginv
- invgpdf
- invgrnd
- iwishpdf
- iwishrnd
- jsucdf
- jsupdf
- laplacecdf
- laplaceinv
- laplacepdf
- laplacernd
- logicdf
- logiinv
- logipdf
- logirnd
- loglcdf
- loglinv
- loglpdf
- loglrnd
- logncdf
- logninv
- lognpdf
- lognrnd
- mnpdf
- mnrnd
- mvncdf
- mvnpdf
- mvnrnd
- mvtcdf
- mvtpdf
- mvtrnd
- mvtcdfqmc
- nakacdf
- nakainv
- nakapdf
- nakarnd
- nbincdf
- nbininv
- nbinpdf
- nbinrnd
- ncfcdf
- ncfinv
- ncfpdf
- ncfrnd
- nctcdf
- nctinv
- nctpdf
- nctrnd
- ncx2cdf
- ncx2inv
- ncx2pdf
- ncx2rnd
- normcdf
- norminv
- normpdf
- normrnd
- plcdf
- plinv
- plpdf
- plrnd
- poisscdf
- poissinv
- poisspdf
- poissrnd
- raylcdf
- raylinv
- raylpdf
- raylrnd
- ricecdf
- riceinv
- ricepdf
- ricernd
- tcdf
- tinv
- tpdf
- trnd
- tlscdf
- tlsinv
- tlspdf
- tlsrnd
- tricdf
- triinv
- tripdf
- trirnd
- unidcdf
- unidinv
- unidpdf
- unidrnd
- unifcdf
- unifinv
- unifpdf
- unifrnd
- vmcdf
- vminv
- vmpdf
- vmrnd
- wblcdf
- wblinv
- wblpdf
- wblrnd
- wienrnd
- wishpdf
- wishrnd
- adtest
- anova
- anova1
- anova2
- anovan
- bartlett_test
- barttest
- binotest
- chi2gof
- chi2test
- correlation_test
- fishertest
- friedman
- hotelling_t2test
- hotelling_t2test2
- kruskalwallis
- kstest
- kstest2
- levene_test
- manova1
- mcnemar_test
- multcompare
- ranksum
- regression_ftest
- regression_ttest
- runstest
- sampsizepwr
- signrank
- signtest
- tiedrank
- ttest
- ttest2
- vartest
- vartest2
- vartestn
- ztest
- ztest2
Function Reference: wblplot
statistics: wblplot (data, …)
statistics: handle = wblplot (data, …)
statistics: [handle, param] = wblplot (data)
statistics: [handle, param] = wblplot (data, censor)
statistics: [handle, param] = wblplot (data, censor, freq)
statistics: [handle, param] = wblplot (data, censor, freq, confint)
statistics: [handle, param] = wblplot (data, censor, freq, confint, fancygrid)
statistics: [handle, param] = wblplot (data, censor, freq, confint, fancygrid, showlegend)
Plot a column vector data on a Weibull probability plot using rank regression.
censor: optional parameter is a column vector of same size as data with 1 for right censored data and 0 for exact observation. Pass [] when no censor data are available.
freq: optional vector same size as data with the number of occurrences for corresponding data. Pass [] when no frequency data are available.
confint: optional confidence limits for plotting upper and lower confidence bands using beta binomial confidence bounds. If a single value is given this will be used such as LOW = a and HIGH = 1 - a. Pass [] if confidence bounds is not requested.
fancygrid: optional parameter which if set to anything but 1 will turn off the fancy gridlines.
showlegend: optional parameter that when set to zero(0) turns off the legend.
If one output argument is given, a handle for the data marker and plotlines is returned, which can be used for further modification of line and marker style.
If a second output argument is specified, a param vector with scale, shape and correlation factor is returned.
Source Code: wblplot
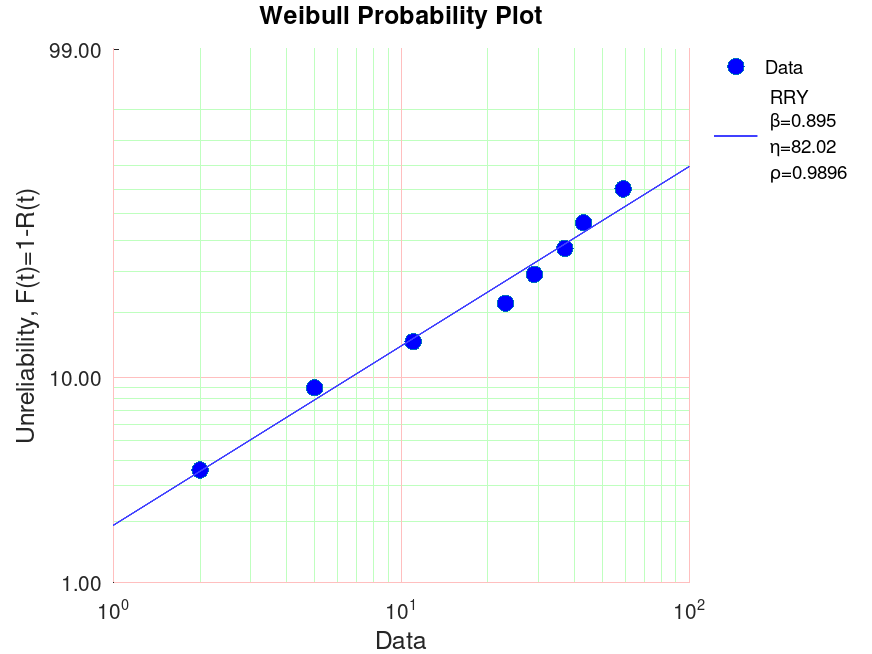
Example: 1
 x = [16 34 53 75 93 120];
 wblplot (x);
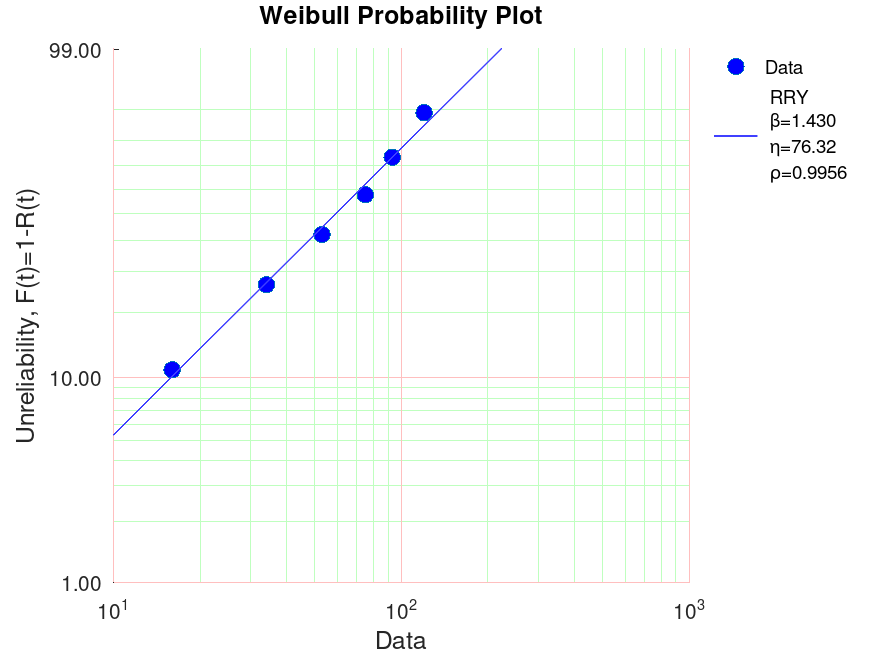
Example: 2
 x = [2 3 5 7 11 13 17 19 23 29 31 37 41 43 47 53 59 61 67]';
 c = [0 1 0 1 0 1 1 1 0 0 1 0 1 0 1 1 0 1 1]';
 [h, p] = wblplot (x, c);
 p
p =

   82.0192    0.8951    0.9896
Example: 3
 x = [16, 34, 53, 75, 93, 120, 150, 191, 240 ,339];
 [h, p] = wblplot (x, [], [], 0.05);
 p
p =

   146.2545     1.1973     0.9999
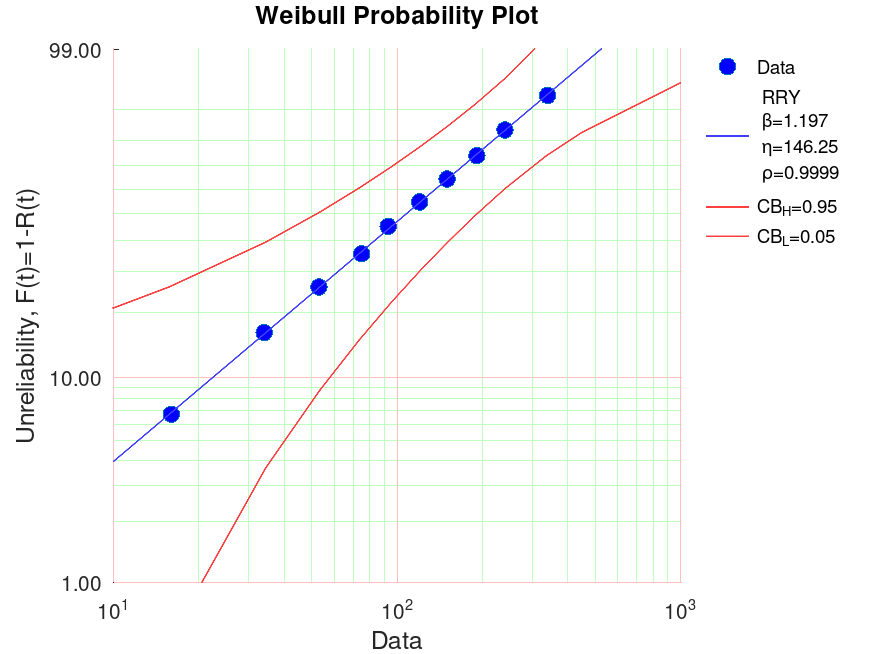
Benchmark Reliasoft eta = 146.2545 beta 1.1973 rho = 0.9999
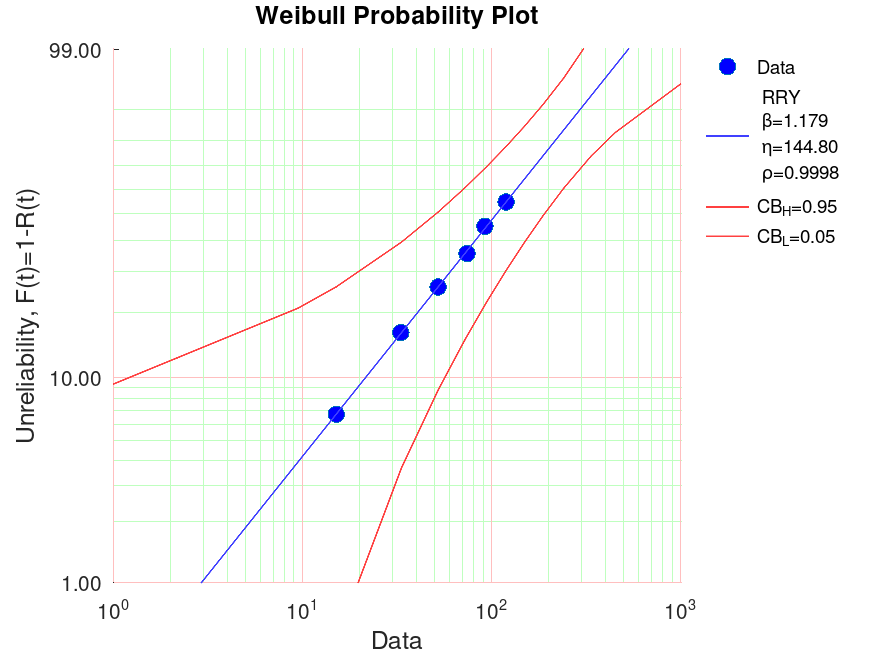
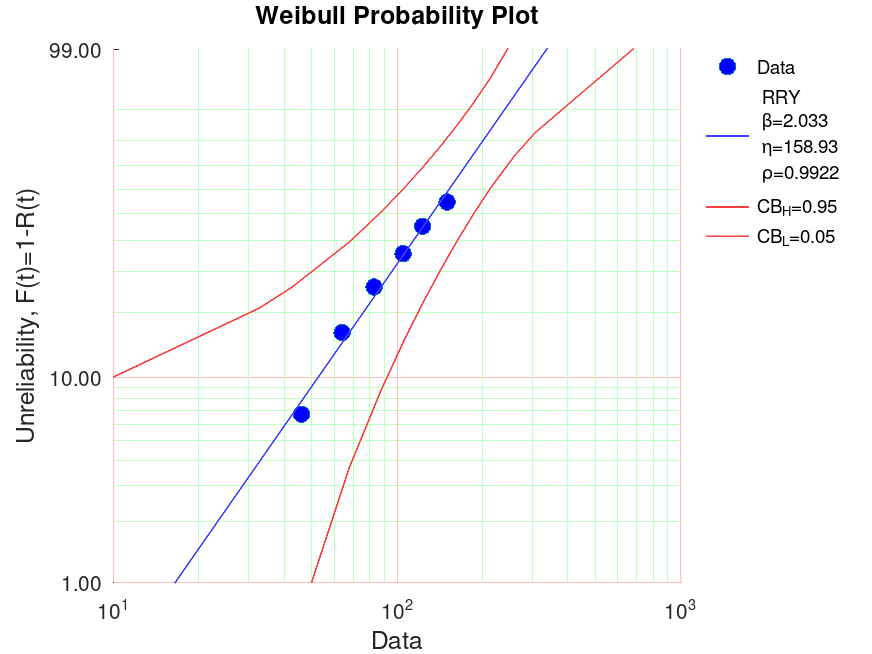
Example: 4
 x = [46 64 83 105 123 150 150];
 c = [0 0 0 0 0 0 1];
 f = [1 1 1 1 1 1 4];
 wblplot (x, c, f, 0.05);
Example: 5
 x = [46 64 83 105 123 150 150];
 c = [0 0 0 0 0 0 1];
 f = [1 1 1 1 1 1 4];
Subtract 30.92 from x to simulate a 3 parameter wbl with gamma = 30.92
wblplot (x - 30.92, c, f, 0.05);