Categories &
Functions List
- BetaDistribution
- BinomialDistribution
- BirnbaumSaundersDistribution
- BurrDistribution
- ExponentialDistribution
- ExtremeValueDistribution
- GammaDistribution
- GeneralizedExtremeValueDistribution
- GeneralizedParetoDistribution
- HalfNormalDistribution
- InverseGaussianDistribution
- LogisticDistribution
- LoglogisticDistribution
- LognormalDistribution
- LoguniformDistribution
- MultinomialDistribution
- NakagamiDistribution
- NegativeBinomialDistribution
- NormalDistribution
- PiecewiseLinearDistribution
- PoissonDistribution
- RayleighDistribution
- RicianDistribution
- tLocationScaleDistribution
- TriangularDistribution
- UniformDistribution
- WeibullDistribution
- betafit
- betalike
- binofit
- binolike
- bisafit
- bisalike
- burrfit
- burrlike
- evfit
- evlike
- expfit
- explike
- gamfit
- gamlike
- geofit
- gevfit_lmom
- gevfit
- gevlike
- gpfit
- gplike
- gumbelfit
- gumbellike
- hnfit
- hnlike
- invgfit
- invglike
- logifit
- logilike
- loglfit
- logllike
- lognfit
- lognlike
- nakafit
- nakalike
- nbinfit
- nbinlike
- normfit
- normlike
- poissfit
- poisslike
- raylfit
- rayllike
- ricefit
- ricelike
- tlsfit
- tlslike
- unidfit
- unifit
- wblfit
- wbllike
- betacdf
- betainv
- betapdf
- betarnd
- binocdf
- binoinv
- binopdf
- binornd
- bisacdf
- bisainv
- bisapdf
- bisarnd
- burrcdf
- burrinv
- burrpdf
- burrrnd
- bvncdf
- bvtcdf
- cauchycdf
- cauchyinv
- cauchypdf
- cauchyrnd
- chi2cdf
- chi2inv
- chi2pdf
- chi2rnd
- copulacdf
- copulapdf
- copularnd
- evcdf
- evinv
- evpdf
- evrnd
- expcdf
- expinv
- exppdf
- exprnd
- fcdf
- finv
- fpdf
- frnd
- gamcdf
- gaminv
- gampdf
- gamrnd
- geocdf
- geoinv
- geopdf
- geornd
- gevcdf
- gevinv
- gevpdf
- gevrnd
- gpcdf
- gpinv
- gppdf
- gprnd
- gumbelcdf
- gumbelinv
- gumbelpdf
- gumbelrnd
- hncdf
- hninv
- hnpdf
- hnrnd
- hygecdf
- hygeinv
- hygepdf
- hygernd
- invgcdf
- invginv
- invgpdf
- invgrnd
- iwishpdf
- iwishrnd
- jsucdf
- jsupdf
- laplacecdf
- laplaceinv
- laplacepdf
- laplacernd
- logicdf
- logiinv
- logipdf
- logirnd
- loglcdf
- loglinv
- loglpdf
- loglrnd
- logncdf
- logninv
- lognpdf
- lognrnd
- mnpdf
- mnrnd
- mvncdf
- mvnpdf
- mvnrnd
- mvtcdf
- mvtpdf
- mvtrnd
- mvtcdfqmc
- nakacdf
- nakainv
- nakapdf
- nakarnd
- nbincdf
- nbininv
- nbinpdf
- nbinrnd
- ncfcdf
- ncfinv
- ncfpdf
- ncfrnd
- nctcdf
- nctinv
- nctpdf
- nctrnd
- ncx2cdf
- ncx2inv
- ncx2pdf
- ncx2rnd
- normcdf
- norminv
- normpdf
- normrnd
- plcdf
- plinv
- plpdf
- plrnd
- poisscdf
- poissinv
- poisspdf
- poissrnd
- raylcdf
- raylinv
- raylpdf
- raylrnd
- ricecdf
- riceinv
- ricepdf
- ricernd
- tcdf
- tinv
- tpdf
- trnd
- tlscdf
- tlsinv
- tlspdf
- tlsrnd
- tricdf
- triinv
- tripdf
- trirnd
- unidcdf
- unidinv
- unidpdf
- unidrnd
- unifcdf
- unifinv
- unifpdf
- unifrnd
- vmcdf
- vminv
- vmpdf
- vmrnd
- wblcdf
- wblinv
- wblpdf
- wblrnd
- wienrnd
- wishpdf
- wishrnd
- adtest
- anova
- anova1
- anova2
- anovan
- bartlett_test
- barttest
- binotest
- chi2gof
- chi2test
- correlation_test
- fishertest
- friedman
- hotelling_t2test
- hotelling_t2test2
- kruskalwallis
- kstest
- kstest2
- levene_test
- manova1
- mcnemar_test
- multcompare
- ranksum
- regression_ftest
- regression_ttest
- runstest
- sampsizepwr
- signrank
- signtest
- tiedrank
- ttest
- ttest2
- vartest
- vartest2
- vartestn
- ztest
- ztest2
Function Reference: ecdf
statistics: [f, x] = ecdf (y)
statistics: [f, x, flo, fup] = ecdf (y)
statistics: ecdf (…)
statistics: ecdf (ax, …)
statistics: […] = ecdf (y, name, value, …)
statistics: […] = ecdf (ax, y, name, value, …)
Empirical (Kaplan-Meier) cumulative distribution function.
[f, x] = ecdf (y) calculates the Kaplan-Meier
estimate of the cumulative distribution function (cdf), also known as the
empirical cdf. y is a vector of data values. f is a vector of
values of the empirical cdf evaluated at x.
[f, x, flo, fup] = ecdf (y) also returns
lower and upper confidence bounds for the cdf. These bounds are calculated
using Greenwood’s formula, and are not simultaneous confidence bounds.
ecdf (…) without output arguments produces a plot of the
empirical cdf.
ecdf (ax, …) plots into existing axes ax.
[…] = ecdf (y, name, value, …) specifies
additional parameter name/value pairs chosen from the following:
| name | value |
|---|---|
| "censoring" | A boolean vector of the same size as Y that is 1 for observations that are right-censored and 0 for observations that are observed exactly. Default is all observations observed exactly. |
| "frequency" | A vector of the same size as Y containing non-negative integer counts. The jth element of this vector gives the number of times the jth element of Y was observed. Default is 1 observation per Y element. |
| "alpha" | A value alpha between 0 and 1 specifying the significance level. Default is 0.05 for 5% significance. |
| "function" | The type of function returned as the F output argument, chosen from "cdf" (the default), "survivor", or "cumulative hazard". |
| "bounds" | Either "on" to include bounds or "off" (the default) to omit them. Used only for plotting. |
Type demo ecdf to see examples of usage.
See also: cdfplot, ecdfhist
Source Code: ecdf
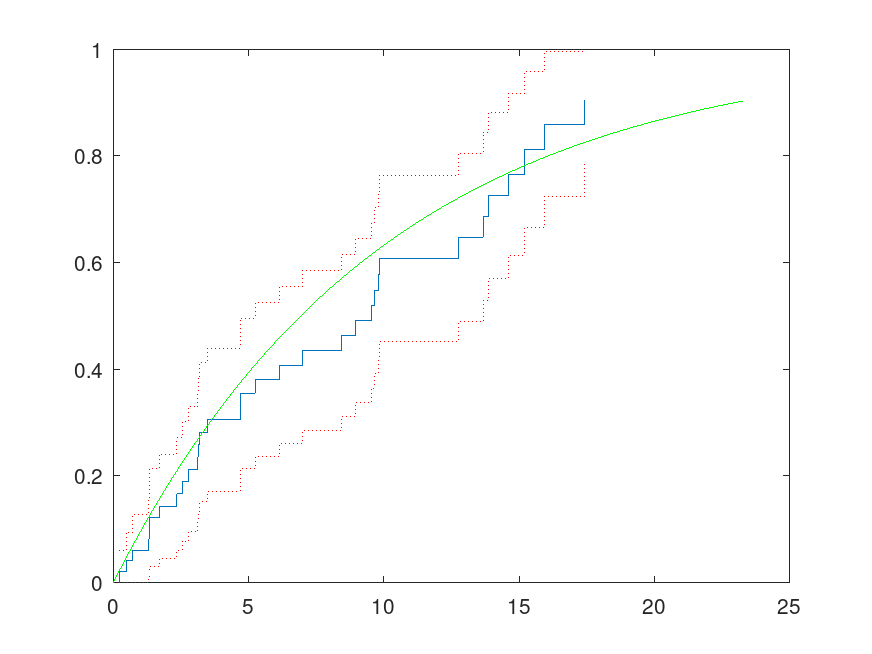
Example: 1
 y = exprnd (10, 50, 1);    ## random failure times are exponential(10)
 d = exprnd (20, 50, 1);    ## drop-out times are exponential(20)
 t = min (y, d);            ## we observe the minimum of these times
 censored = (y > d);        ## we also observe whether the subject failed
Calculate and plot the empirical cdf and confidence bounds
 [f, x, flo, fup] = ecdf (t, 'censoring', censored);
 stairs (x, f);
 hold on;
 stairs (x, flo, 'r:'); stairs (x, fup, 'r:');
Superimpose a plot of the known true cdf
 xx = 0:.1:max (t); yy = 1 - exp (-xx / 10); plot (xx, yy, 'g-');
 hold off;
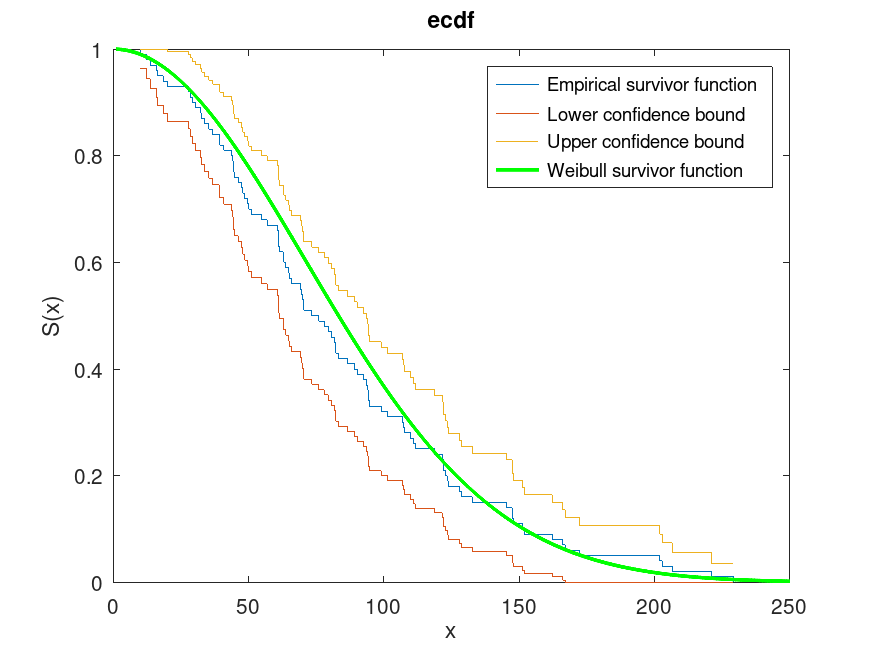
Example: 2
 R = wblrnd (100, 2, 100, 1);
 ecdf (R, 'Function', 'survivor', 'Alpha', 0.01, 'Bounds', 'on');
 hold on
 x = 1:1:250;
 wblsurv = 1 - cdf ('weibull', x, 100, 2);
 plot (x, wblsurv, 'g-', 'LineWidth', 2)
 legend ('Empirical survivor function', 'Lower confidence bound', ...
         'Upper confidence bound', 'Weibull survivor function', ...
         'Location', 'northeast');
 hold off