Categories &
Functions List
- BetaDistribution
- BinomialDistribution
- BirnbaumSaundersDistribution
- BurrDistribution
- ExponentialDistribution
- ExtremeValueDistribution
- GammaDistribution
- GeneralizedExtremeValueDistribution
- GeneralizedParetoDistribution
- HalfNormalDistribution
- InverseGaussianDistribution
- LogisticDistribution
- LoglogisticDistribution
- LognormalDistribution
- LoguniformDistribution
- MultinomialDistribution
- NakagamiDistribution
- NegativeBinomialDistribution
- NormalDistribution
- PiecewiseLinearDistribution
- PoissonDistribution
- RayleighDistribution
- RicianDistribution
- tLocationScaleDistribution
- TriangularDistribution
- UniformDistribution
- WeibullDistribution
- betafit
- betalike
- binofit
- binolike
- bisafit
- bisalike
- burrfit
- burrlike
- evfit
- evlike
- expfit
- explike
- gamfit
- gamlike
- geofit
- gevfit_lmom
- gevfit
- gevlike
- gpfit
- gplike
- gumbelfit
- gumbellike
- hnfit
- hnlike
- invgfit
- invglike
- logifit
- logilike
- loglfit
- logllike
- lognfit
- lognlike
- nakafit
- nakalike
- nbinfit
- nbinlike
- normfit
- normlike
- poissfit
- poisslike
- raylfit
- rayllike
- ricefit
- ricelike
- tlsfit
- tlslike
- unidfit
- unifit
- wblfit
- wbllike
- betacdf
- betainv
- betapdf
- betarnd
- binocdf
- binoinv
- binopdf
- binornd
- bisacdf
- bisainv
- bisapdf
- bisarnd
- burrcdf
- burrinv
- burrpdf
- burrrnd
- bvncdf
- bvtcdf
- cauchycdf
- cauchyinv
- cauchypdf
- cauchyrnd
- chi2cdf
- chi2inv
- chi2pdf
- chi2rnd
- copulacdf
- copulapdf
- copularnd
- evcdf
- evinv
- evpdf
- evrnd
- expcdf
- expinv
- exppdf
- exprnd
- fcdf
- finv
- fpdf
- frnd
- gamcdf
- gaminv
- gampdf
- gamrnd
- geocdf
- geoinv
- geopdf
- geornd
- gevcdf
- gevinv
- gevpdf
- gevrnd
- gpcdf
- gpinv
- gppdf
- gprnd
- gumbelcdf
- gumbelinv
- gumbelpdf
- gumbelrnd
- hncdf
- hninv
- hnpdf
- hnrnd
- hygecdf
- hygeinv
- hygepdf
- hygernd
- invgcdf
- invginv
- invgpdf
- invgrnd
- iwishpdf
- iwishrnd
- jsucdf
- jsupdf
- laplacecdf
- laplaceinv
- laplacepdf
- laplacernd
- logicdf
- logiinv
- logipdf
- logirnd
- loglcdf
- loglinv
- loglpdf
- loglrnd
- logncdf
- logninv
- lognpdf
- lognrnd
- mnpdf
- mnrnd
- mvncdf
- mvnpdf
- mvnrnd
- mvtcdf
- mvtpdf
- mvtrnd
- mvtcdfqmc
- nakacdf
- nakainv
- nakapdf
- nakarnd
- nbincdf
- nbininv
- nbinpdf
- nbinrnd
- ncfcdf
- ncfinv
- ncfpdf
- ncfrnd
- nctcdf
- nctinv
- nctpdf
- nctrnd
- ncx2cdf
- ncx2inv
- ncx2pdf
- ncx2rnd
- normcdf
- norminv
- normpdf
- normrnd
- plcdf
- plinv
- plpdf
- plrnd
- poisscdf
- poissinv
- poisspdf
- poissrnd
- raylcdf
- raylinv
- raylpdf
- raylrnd
- ricecdf
- riceinv
- ricepdf
- ricernd
- tcdf
- tinv
- tpdf
- trnd
- tlscdf
- tlsinv
- tlspdf
- tlsrnd
- tricdf
- triinv
- tripdf
- trirnd
- unidcdf
- unidinv
- unidpdf
- unidrnd
- unifcdf
- unifinv
- unifpdf
- unifrnd
- vmcdf
- vminv
- vmpdf
- vmrnd
- wblcdf
- wblinv
- wblpdf
- wblrnd
- wienrnd
- wishpdf
- wishrnd
- adtest
- anova
- anova1
- anova2
- anovan
- bartlett_test
- barttest
- binotest
- chi2gof
- chi2test
- correlation_test
- fishertest
- friedman
- hotelling_t2test
- hotelling_t2test2
- kruskalwallis
- kstest
- kstest2
- levene_test
- manova1
- mcnemar_test
- multcompare
- ranksum
- regression_ftest
- regression_ttest
- runstest
- sampsizepwr
- signrank
- signtest
- tiedrank
- ttest
- ttest2
- vartest
- vartest2
- vartestn
- ztest
- ztest2
Class Definition: ConfusionMatrixChart
statistics: ConfusionMatrixChart
Confusion matrix chart for classification results
The ConfusionMatrixChart class implements a confusion matrix chart
object, which displays the classification performance of a classifier by
showing the counts of true positive, true negative, false positive, and
false negative predictions.
A confusion matrix chart is a visual representation of the performance of a classification algorithm. The rows represent the true classes and the columns represent the predicted classes. The diagonal elements represent the correctly classified observations, while the off-diagonal elements represent the misclassified observations.
Create a ConfusionMatrixChart object by using the
confusionchart function.
See also: confusionchart
Source Code: ConfusionMatrixChart
The ConfusionMatrixChart class contains the following properties:
A character vector specifying the label for the x-axis. Default is "Predicted Class".
A character vector specifying the label for the y-axis. Default is "True Class".
A character vector specifying the title of the confusion matrix chart. Default is empty string.
A character vector specifying the font name used for all text elements in the chart. Default is empty string, which uses the axes font name.
A numeric scalar specifying the font size used for all text elements in the chart. Default is 0, which uses the axes font size.
A 1x3 RGB vector specifying the color for the diagonal elements of the confusion matrix, which represent correct classifications. Default is [0.0, 0.4471, 0.7412].
A 1x3 RGB vector specifying the color for the off-diagonal elements of the confusion matrix, which represent misclassifications. Default is [0.8510, 0.3255, 0.0980].
A character vector specifying how to normalize the confusion matrix values. Supported values are:
-
'absolute'- Display absolute counts (default) -
'column-normalized'- Normalize by column totals -
'row-normalized'- Normalize by row totals -
'total-normalized'- Normalize by total number of observations
A character vector specifying whether and how to display column summaries. Supported values are:
-
'off'- Do not display column summary (default) -
'absolute'- Display absolute counts -
'column-normalized'- Display normalized by column -
'total-normalized'- Display normalized by total
A character vector specifying whether and how to display row summaries. Supported values are:
-
'off'- Do not display row summary (default) -
'absolute'- Display absolute counts -
'row-normalized'- Display normalized by row -
'total-normalized'- Display normalized by total
A character vector specifying whether to display grid lines in the confusion matrix. Supported values are:
-
'on'- Display grid lines (default) -
'off'- Hide grid lines
A character vector specifying the visibility of the object’s handle.
Supported values are 'on', 'off', and 'callback'.
A 1x4 numeric vector specifying the outer position of the chart in the format [left, bottom, width, height].
A 1x4 numeric vector specifying the position of the chart in the format [left, bottom, width, height].
A character vector specifying the units for the position properties.
Supported values are 'centimeters', 'characters',
'inches', 'normalized', 'pixels', and
'points'.
A cell array of character vectors containing the class labels used in the confusion matrix. This property is read-only.
A numeric matrix containing the normalized confusion matrix values according to the current normalization setting. This property is read-only.
A handle to the parent figure or container object. This property is read-only.
The ConfusionMatrixChart class offers the following public methods:
statistics: cmc = ConfusionMatrixChart (hax, cm, cl)
statistics: cmc = ConfusionMatrixChart (…, name, value)
cmc = ConfusionMatrixChart (hax, cm, cl)
returns a ConfusionMatrixChart object with parent axes hax,
confusion matrix cm, and class labels cl.
-
haxmust be a valid axes handle where the chart will be displayed. -
cmmust be a square numeric matrix containing the confusion matrix values, where rows represent true classes and columns represent predicted classes. -
clmust be a cell array of character vectors containing the class labels. The number of labels must match the size of the confusion matrix.
cmc = ConfusionMatrixChart (…, name,
 value)
returns a ConfusionMatrixChart object with additional parameters
specified by name, value paired arguments:
| Name | Value | |
|---|---|---|
'XLabel' | A character vector specifying the x-axis label. Default is "Predicted Class". | |
'YLabel' | A character vector specifying the y-axis label. Default is "True Class". | |
'Title' | A character vector specifying the chart title. Default is empty string. | |
'FontName' | A character vector specifying the font name for text elements. Default is the axes font name. | |
'FontSize' | A numeric scalar specifying the font size for text elements. Default is the axes font size. | |
'DiagonalColor' | A 1x3 RGB vector specifying the color for diagonal elements (correct classifications). Default is [0.0, 0.4471, 0.7412]. | |
'OffDiagonalColor' | A 1x3 RGB vector specifying the color for off-diagonal elements (misclassifications). Default is [0.8510, 0.3255, 0.0980]. | |
'Normalization' | A character vector specifying
the normalization method. Supported values are 'absolute',
'column-normalized', 'row-normalized', and
'total-normalized'. Default is 'absolute'. | |
'ColumnSummary' | A character vector specifying
whether and how to display column summaries. Supported values are
'off', 'absolute', 'column-normalized', and
'total-normalized'. Default is 'off'. | |
'RowSummary' | A character vector specifying
whether and how to display row summaries. Supported values are
'off', 'absolute', 'row-normalized', and
'total-normalized'. Default is 'off'. | |
'GridVisible' | A character vector specifying
whether to display grid lines. Supported values are 'on' and
'off'. Default is 'on'. | |
'HandleVisibility' | A character vector specifying
the handle visibility. Supported values are 'on', 'off',
and 'callback'. | |
'OuterPosition' | A 1x4 numeric vector specifying the outer position of the chart. | |
'Position' | A 1x4 numeric vector specifying the position of the chart. | |
'Units' | A character vector specifying the
position units. Supported values are 'centimeters',
'characters', 'inches', 'normalized',
'pixels', and 'points'. |
See also: confusionchart
ConfusionMatrixChart: disp (cmc)
disp (cmc) displays the main properties of the
ConfusionMatrixChart object cmc, including the normalized values
and class labels.
See also: ConfusionMatrixChart
ConfusionMatrixChart: sortClasses (cmc, order)
sortClasses (cmc, order) sorts the classes in the
confusion matrix chart cmc according to the specified order.
order can be:
- A cell array of class labels in the desired order
-
'auto'- Sort class labels alphabetically -
'ascending-diagonal'- Sort by ascending diagonal values -
'descending-diagonal'- Sort by descending diagonal values -
'cluster'- Sort using hierarchical clustering
When using 'cluster', the classes are grouped based on similarity
using hierarchical clustering, which can help identify groups of
frequently confused classes.
See also: confusionchart, linkage, pdist
Examples
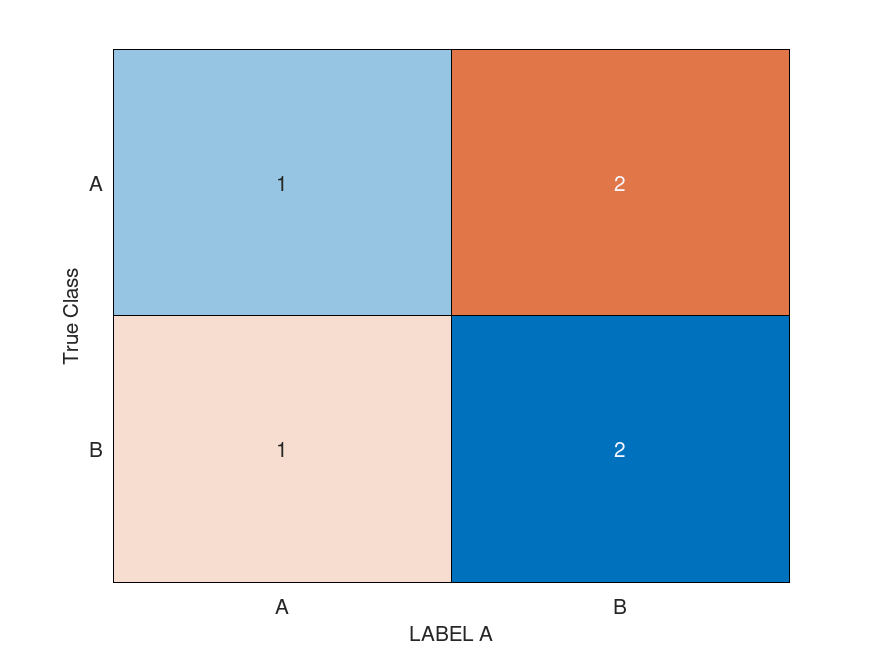
cm = ConfusionMatrixChart (gca, [1 2; 1 2], {'A','B'}, {'XLabel','LABEL A'})
cm =

ConfusionMatrixChart with properties:

	NormalizedValues: [ 2x2 double ]
	ClassLabels: { 1x2 cell }
NormalizedValues = cm.NormalizedValues
NormalizedValues =

   1   2
   1   2
ClassLabels = cm.ClassLabels
ClassLabels =
  1x2 cell array

    {'A'}    {'B'}