Categories &
Functions List
- BetaDistribution
- BinomialDistribution
- BirnbaumSaundersDistribution
- BurrDistribution
- ExponentialDistribution
- ExtremeValueDistribution
- GammaDistribution
- GeneralizedExtremeValueDistribution
- GeneralizedParetoDistribution
- HalfNormalDistribution
- InverseGaussianDistribution
- LogisticDistribution
- LoglogisticDistribution
- LognormalDistribution
- LoguniformDistribution
- MultinomialDistribution
- NakagamiDistribution
- NegativeBinomialDistribution
- NormalDistribution
- PiecewiseLinearDistribution
- PoissonDistribution
- RayleighDistribution
- RicianDistribution
- tLocationScaleDistribution
- TriangularDistribution
- UniformDistribution
- WeibullDistribution
- betafit
- betalike
- binofit
- binolike
- bisafit
- bisalike
- burrfit
- burrlike
- evfit
- evlike
- expfit
- explike
- gamfit
- gamlike
- geofit
- gevfit_lmom
- gevfit
- gevlike
- gpfit
- gplike
- gumbelfit
- gumbellike
- hnfit
- hnlike
- invgfit
- invglike
- logifit
- logilike
- loglfit
- logllike
- lognfit
- lognlike
- nakafit
- nakalike
- nbinfit
- nbinlike
- normfit
- normlike
- poissfit
- poisslike
- raylfit
- rayllike
- ricefit
- ricelike
- tlsfit
- tlslike
- unidfit
- unifit
- wblfit
- wbllike
- betacdf
- betainv
- betapdf
- betarnd
- binocdf
- binoinv
- binopdf
- binornd
- bisacdf
- bisainv
- bisapdf
- bisarnd
- burrcdf
- burrinv
- burrpdf
- burrrnd
- bvncdf
- bvtcdf
- cauchycdf
- cauchyinv
- cauchypdf
- cauchyrnd
- chi2cdf
- chi2inv
- chi2pdf
- chi2rnd
- copulacdf
- copulapdf
- copularnd
- evcdf
- evinv
- evpdf
- evrnd
- expcdf
- expinv
- exppdf
- exprnd
- fcdf
- finv
- fpdf
- frnd
- gamcdf
- gaminv
- gampdf
- gamrnd
- geocdf
- geoinv
- geopdf
- geornd
- gevcdf
- gevinv
- gevpdf
- gevrnd
- gpcdf
- gpinv
- gppdf
- gprnd
- gumbelcdf
- gumbelinv
- gumbelpdf
- gumbelrnd
- hncdf
- hninv
- hnpdf
- hnrnd
- hygecdf
- hygeinv
- hygepdf
- hygernd
- invgcdf
- invginv
- invgpdf
- invgrnd
- iwishpdf
- iwishrnd
- jsucdf
- jsupdf
- laplacecdf
- laplaceinv
- laplacepdf
- laplacernd
- logicdf
- logiinv
- logipdf
- logirnd
- loglcdf
- loglinv
- loglpdf
- loglrnd
- logncdf
- logninv
- lognpdf
- lognrnd
- mnpdf
- mnrnd
- mvncdf
- mvnpdf
- mvnrnd
- mvtcdf
- mvtpdf
- mvtrnd
- mvtcdfqmc
- nakacdf
- nakainv
- nakapdf
- nakarnd
- nbincdf
- nbininv
- nbinpdf
- nbinrnd
- ncfcdf
- ncfinv
- ncfpdf
- ncfrnd
- nctcdf
- nctinv
- nctpdf
- nctrnd
- ncx2cdf
- ncx2inv
- ncx2pdf
- ncx2rnd
- normcdf
- norminv
- normpdf
- normrnd
- plcdf
- plinv
- plpdf
- plrnd
- poisscdf
- poissinv
- poisspdf
- poissrnd
- raylcdf
- raylinv
- raylpdf
- raylrnd
- ricecdf
- riceinv
- ricepdf
- ricernd
- tcdf
- tinv
- tpdf
- trnd
- tlscdf
- tlsinv
- tlspdf
- tlsrnd
- tricdf
- triinv
- tripdf
- trirnd
- unidcdf
- unidinv
- unidpdf
- unidrnd
- unifcdf
- unifinv
- unifpdf
- unifrnd
- vmcdf
- vminv
- vmpdf
- vmrnd
- wblcdf
- wblinv
- wblpdf
- wblrnd
- wienrnd
- wishpdf
- wishrnd
- adtest
- anova
- anova1
- anova2
- anovan
- bartlett_test
- barttest
- binotest
- chi2gof
- chi2test
- correlation_test
- fishertest
- friedman
- hotelling_t2test
- hotelling_t2test2
- kruskalwallis
- kstest
- kstest2
- levene_test
- manova1
- mcnemar_test
- multcompare
- ranksum
- regression_ftest
- regression_ttest
- runstest
- sampsizepwr
- signrank
- signtest
- tiedrank
- ttest
- ttest2
- vartest
- vartest2
- vartestn
- ztest
- ztest2
Function Reference: normfit
statistics: muhat = normfit (x)
statistics: [muhat, sigmahat] = normfit (x)
statistics: [muhat, sigmahat, muci] = normfit (x)
statistics: [muhat, sigmahat, muci, sigmaci] = normfit (x)
statistics: […] = normfit (x, alpha)
statistics: […] = normfit (x, alpha, censor)
statistics: […] = normfit (x, alpha, censor, freq)
statistics: […] = normfit (x, alpha, censor, freq, options)
Estimate parameters and confidence intervals for the normal distribution.
[muhat, sigmahat] = normfit (x) estimates the
parameters of the normal distribution given the data in x. muhat
is an estimate of the mean, and sigmahat is an estimate of the standard
deviation.
[muhat, sigmahat, muci, sigmaci] = normfit
 (x)
returns the 95% confidence intervals for the mean and standard
deviation estimates in the arrays muci and sigmaci, respectively.
-
x can be a vector or a matrix. When x is a matrix, the parameter
estimates and their confidence intervals are computed for each column. In
this case,
normfitsupports only 2 input arguments, x and alpha. Optional arguments censor, freq, and options can be used only when x is a vector. -
alpha is a scalar value in the range specifying the
confidence level for the confidence intervals calculated as
. By default, the optional argument alpha is
0.05 corresponding to 95% confidence intervals. Pass in
[]for alpha to use the default values. - censor is a logical vector of the same length as x specifying whether each value in x is right-censored or not. 1 indicates observations that are right-censored and 0 indicates observations that are fully observed. With censoring, muhat and sigmahat are the maximum likelihood estimates (MLEs). If empty, the default is an array of 0s, meaning that all observations are fully observed.
-
freq is a vector of the same length as x and it typically
contains non-negative integer counts of the corresponding elements in
x. If empty, the default is an array of 1s, meaning one observation
per element of x. To obtain the weighted MLEs for a data set with
censoring, specify weights of observations, normalized to the number of
observations in x. However, when there is no censored data (default),
the returned estimate for standard deviation is not exactly the WMLE. To
compute the weighted MLE, multiply the value returned in sigmahat by
(SUM (freq) - 1) / SUM (freq). This correction is needed becausenormfitnormally computes sigmahat using an unbiased variance estimator when there is no censored data. When there is censoring in the data, the correction is not needed, sincenormfitdoes not use the unbiased variance estimator in that case. -
options is a structure with the control parameters for
fminsearchwhich is used internally to compute MLEs for censored data. By default, it uses the following options:-
options.Display = "off" -
options.MaxFunEvals = 400 -
options.MaxIter = 200 -
options.TolX = 1e-6
-
Further information about the normal distribution can be found at https://en.wikipedia.org/wiki/Normal_distribution
See also: normcdf, norminv, normpdf, normrnd, normlike, normstat
Source Code: normfit
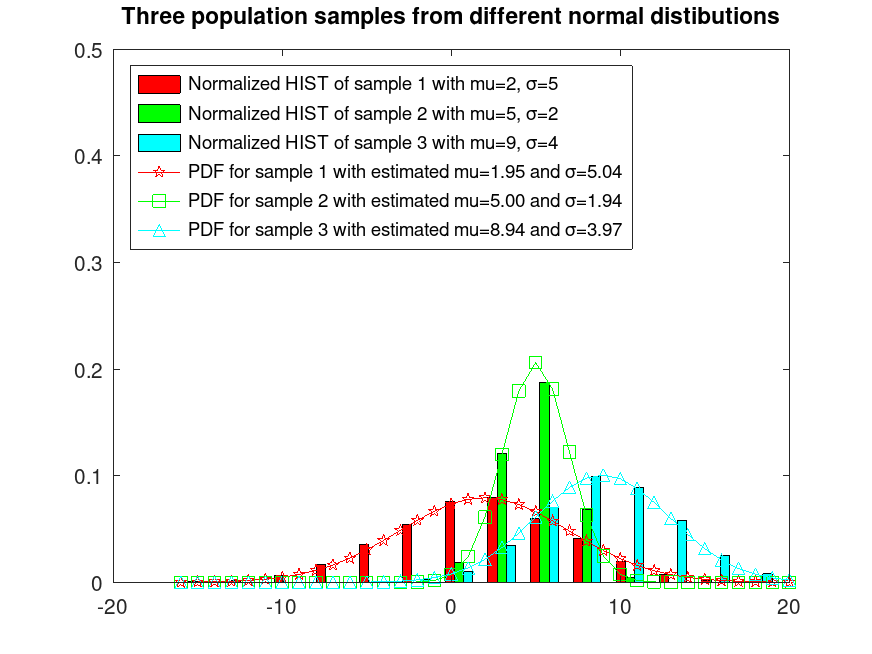
Example: 1
Sample 3 populations from 3 different normal distributions
 randn ('seed', 1);    # for reproducibility
 r1 = normrnd (2, 5, 5000, 1);
 randn ('seed', 2);    # for reproducibility
 r2 = normrnd (5, 2, 5000, 1);
 randn ('seed', 3);    # for reproducibility
 r3 = normrnd (9, 4, 5000, 1);
 r = [r1, r2, r3];
Plot them normalized and fix their colors
 hist (r, 15, 0.4);
 h = findobj (gca, 'Type', 'patch');
 set (h(1), 'facecolor', 'c');
 set (h(2), 'facecolor', 'g');
 set (h(3), 'facecolor', 'r');
 hold on
Estimate their mu and sigma parameters
[muhat, sigmahat] = normfit (r);
Plot their estimated PDFs
 x = [min(r(:)):max(r(:))];
 y = normpdf (x, muhat(1), sigmahat(1));
 plot (x, y, '-pr');
 y = normpdf (x, muhat(2), sigmahat(2));
 plot (x, y, '-sg');
 y = normpdf (x, muhat(3), sigmahat(3));
 plot (x, y, '-^c');
 ylim ([0, 0.5])
 xlim ([-20, 20])
 hold off
 legend ({'Normalized HIST of sample 1 with mu=2, σ=5', ...
          'Normalized HIST of sample 2 with mu=5, σ=2', ...
          'Normalized HIST of sample 3 with mu=9, σ=4', ...
          sprintf("PDF for sample 1 with estimated mu=%0.2f and σ=%0.2f", ...
                  muhat(1), sigmahat(1)), ...
          sprintf("PDF for sample 2 with estimated mu=%0.2f and σ=%0.2f", ...
                  muhat(2), sigmahat(2)), ...
          sprintf("PDF for sample 3 with estimated mu=%0.2f and σ=%0.2f", ...
                  muhat(3), sigmahat(3))}, 'location', 'northwest')
 title ('Three population samples from different normal distributions')
 hold off