Categories &
Functions List
- BetaDistribution
- BinomialDistribution
- BirnbaumSaundersDistribution
- BurrDistribution
- ExponentialDistribution
- ExtremeValueDistribution
- GammaDistribution
- GeneralizedExtremeValueDistribution
- GeneralizedParetoDistribution
- HalfNormalDistribution
- InverseGaussianDistribution
- LogisticDistribution
- LoglogisticDistribution
- LognormalDistribution
- LoguniformDistribution
- MultinomialDistribution
- NakagamiDistribution
- NegativeBinomialDistribution
- NormalDistribution
- PiecewiseLinearDistribution
- PoissonDistribution
- RayleighDistribution
- RicianDistribution
- tLocationScaleDistribution
- TriangularDistribution
- UniformDistribution
- WeibullDistribution
- betafit
- betalike
- binofit
- binolike
- bisafit
- bisalike
- burrfit
- burrlike
- evfit
- evlike
- expfit
- explike
- gamfit
- gamlike
- geofit
- gevfit_lmom
- gevfit
- gevlike
- gpfit
- gplike
- gumbelfit
- gumbellike
- hnfit
- hnlike
- invgfit
- invglike
- logifit
- logilike
- loglfit
- logllike
- lognfit
- lognlike
- nakafit
- nakalike
- nbinfit
- nbinlike
- normfit
- normlike
- poissfit
- poisslike
- raylfit
- rayllike
- ricefit
- ricelike
- tlsfit
- tlslike
- unidfit
- unifit
- wblfit
- wbllike
- betacdf
- betainv
- betapdf
- betarnd
- binocdf
- binoinv
- binopdf
- binornd
- bisacdf
- bisainv
- bisapdf
- bisarnd
- burrcdf
- burrinv
- burrpdf
- burrrnd
- bvncdf
- bvtcdf
- cauchycdf
- cauchyinv
- cauchypdf
- cauchyrnd
- chi2cdf
- chi2inv
- chi2pdf
- chi2rnd
- copulacdf
- copulapdf
- copularnd
- evcdf
- evinv
- evpdf
- evrnd
- expcdf
- expinv
- exppdf
- exprnd
- fcdf
- finv
- fpdf
- frnd
- gamcdf
- gaminv
- gampdf
- gamrnd
- geocdf
- geoinv
- geopdf
- geornd
- gevcdf
- gevinv
- gevpdf
- gevrnd
- gpcdf
- gpinv
- gppdf
- gprnd
- gumbelcdf
- gumbelinv
- gumbelpdf
- gumbelrnd
- hncdf
- hninv
- hnpdf
- hnrnd
- hygecdf
- hygeinv
- hygepdf
- hygernd
- invgcdf
- invginv
- invgpdf
- invgrnd
- iwishpdf
- iwishrnd
- jsucdf
- jsupdf
- laplacecdf
- laplaceinv
- laplacepdf
- laplacernd
- logicdf
- logiinv
- logipdf
- logirnd
- loglcdf
- loglinv
- loglpdf
- loglrnd
- logncdf
- logninv
- lognpdf
- lognrnd
- mnpdf
- mnrnd
- mvncdf
- mvnpdf
- mvnrnd
- mvtcdf
- mvtpdf
- mvtrnd
- mvtcdfqmc
- nakacdf
- nakainv
- nakapdf
- nakarnd
- nbincdf
- nbininv
- nbinpdf
- nbinrnd
- ncfcdf
- ncfinv
- ncfpdf
- ncfrnd
- nctcdf
- nctinv
- nctpdf
- nctrnd
- ncx2cdf
- ncx2inv
- ncx2pdf
- ncx2rnd
- normcdf
- norminv
- normpdf
- normrnd
- plcdf
- plinv
- plpdf
- plrnd
- poisscdf
- poissinv
- poisspdf
- poissrnd
- raylcdf
- raylinv
- raylpdf
- raylrnd
- ricecdf
- riceinv
- ricepdf
- ricernd
- tcdf
- tinv
- tpdf
- trnd
- tlscdf
- tlsinv
- tlspdf
- tlsrnd
- tricdf
- triinv
- tripdf
- trirnd
- unidcdf
- unidinv
- unidpdf
- unidrnd
- unifcdf
- unifinv
- unifpdf
- unifrnd
- vmcdf
- vminv
- vmpdf
- vmrnd
- wblcdf
- wblinv
- wblpdf
- wblrnd
- wienrnd
- wishpdf
- wishrnd
- adtest
- anova
- anova1
- anova2
- anovan
- bartlett_test
- barttest
- binotest
- chi2gof
- chi2test
- correlation_test
- fishertest
- friedman
- hotelling_t2test
- hotelling_t2test2
- kruskalwallis
- kstest
- kstest2
- levene_test
- manova1
- mcnemar_test
- multcompare
- ranksum
- regression_ftest
- regression_ttest
- runstest
- sampsizepwr
- signrank
- signtest
- tiedrank
- ttest
- ttest2
- vartest
- vartest2
- vartestn
- ztest
- ztest2
Function Reference: sampsizepwr
statistics: n = sampsizepwr (testtype, params, p1)
statistics: n = sampsizepwr (testtype, params, p1, power)
statistics: power = sampsizepwr (testtype, params, p1, [], n)
statistics: p1 = sampsizepwr (testtype, params, [], power, n)
statistics: [n1, n2] = sampsizepwr (
't2', params, p1, power)statistics: […] = sampsizepwr (testtype, params, p1, power, n, name, value)
Sample size and power calculation for hypothesis test.
sampsizepwr computes the sample size, power, or alternative parameter
value for a hypothesis test, given the other two values. For example, you can
compute the sample size required to obtain a particular power for a
hypothesis test, given the parameter value of the alternative hypothesis.
n = sampsizepwr (testtype, params, p1) returns
the sample size N required for a two-sided test of the specified type to have
a power (probability of rejecting the null hypothesis when the alternative is
true) of 0.90 when the significance level (probability of rejecting the null
hypothesis when the null hypothesis is true) is 0.05. params specifies
the parameter values under the null hypothesis. P1 specifies the value of
the single parameter being tested under the alternative hypothesis. For the
two-sample t-test, N is the value of the equal sample size for both samples,
params specifies the parameter values of the first sample under the
null and alternative hypotheses, and P1 specifies the value of the single
parameter from the other sample under the alternative hypothesis.
The following TESTTYPE values are available:
| "z" | one-sample z-test for normally distributed data with known standard deviation. params is a two-element vector [MU0 SIGMA0] of the mean and standard deviation, respectively, under the null hypothesis. P1 is the value of the mean under the alternative hypothesis. | |
| "t" | one-sample t-test or paired t-test for normally distributed data with unknown standard deviation. params is a two-element vector [MU0 SIGMA0] of the mean and standard deviation, respectively, under the null hypothesis. P1 is the value of the mean under the alternative hypothesis. | |
| "t2" | two-sample pooled t-test (test for equal means) for normally distributed data with equal unknown standard deviations. params is a two-element vector [MU0 SIGMA0] of the mean and standard deviation of the first sample under the null and alternative hypotheses. P1 is the the mean of the second sample under the alternative hypothesis. | |
| "var" | chi-square test of variance for normally distributed data. params is the variance under the null hypothesis. P1 is the variance under the alternative hypothesis. | |
| "p" | test of the P parameter (success probability) for a binomial distribution. params is the value of P under the null hypothesis. P1 is the value of P under the alternative hypothesis. | |
| "r" | test of the correlation coefficient parameter for significance. params is the value of r under the null hypothesis. P1 is the value of r under the alternative hypothesis. |
The "p" test for the binomial distribution is a discrete test for which increasing the sample size does not always increase the power. For N values larger than 200, there may be values smaller than the returned N value that also produce the desired power.
n = sampsizepwr (testtype, params, p1,
 power)
returns the sample size N such that the power is power
for the parameter value P1. For the two-sample t-test, N is the equal sample
size of both samples.
[n1, n2] = sampsizepwr ("t2", params, p1,
 power)
returns the sample sizes n1 and n2 for the two
samples. These values are the same unless the "ratio" parameter,
ratio = n2 / n2, is set to a value other than
the default (See the name/value pair definition of ratio below).
power = sampsizepwr (testtype, params, p1, [],
 n)
returns the power achieved for a sample size of n when the
true parameter value is p1. For the two-sample t-test, n is the
smaller one of the two sample sizes.
p1 = sampsizepwr (testtype, params, [], power,
 n)
returns the parameter value detectable with the specified sample
size n and power power. For the two-sample t-test, n is
the smaller one of the two sample sizes. When computing p1 for the "p"
test, if no alternative can be rejected for a given params, n and
power value, the function displays a warning message and returns NaN.
[…] = sampsizepwr (…, n, name, value)
specifies one or more of the following name / value pairs:
| "alpha" | significance level of the test (default is 0.05) | |
| "tail" | the type of test which can be: |
| "both" | two-sided test for an alternative p1 not equal to params | |
| "right" | one-sided test for an alternative p1 larger than params | |
| "left" | one-sided test for an alternative p1 smaller than params |
| "ratio" | desired ratio n2 / n2 of the larger
sample size n2 to the smaller sample size n1. Used only for the
two-sample t-test. The value of ratio is greater than or equal
to 1 (default is 1). |
sampsizepwr computes the sample size, power, or alternative hypothesis
value given values for the other two. Specify one of these as [] to compute
it. The remaining parameters (and ALPHA, RATIO) can be scalars or arrays of
the same size.
See also: vartest, ttest, ttest2, ztest, binocdf
Source Code: sampsizepwr
Example: 1
Compute the mean closest to 100 that can be determined to be significantly different from 100 using a t-test with a sample size of 60 and a power of 0.8.
 mu1 = sampsizepwr ('t', [100, 10], [], 0.8, 60);
 disp (mu1);
103.68
Example: 2
Compute the sample sizes required to distinguish mu0 = 100 from mu1 = 110 by a two-sample t-test with a ratio of the larger and the smaller sample sizes of 1.5 and a power of 0.6.
[N1,N2] = sampsizepwr ('t2', [100, 10], 110, 0.6, [], 'ratio', 1.5)
N1 = 9
N2 = 14
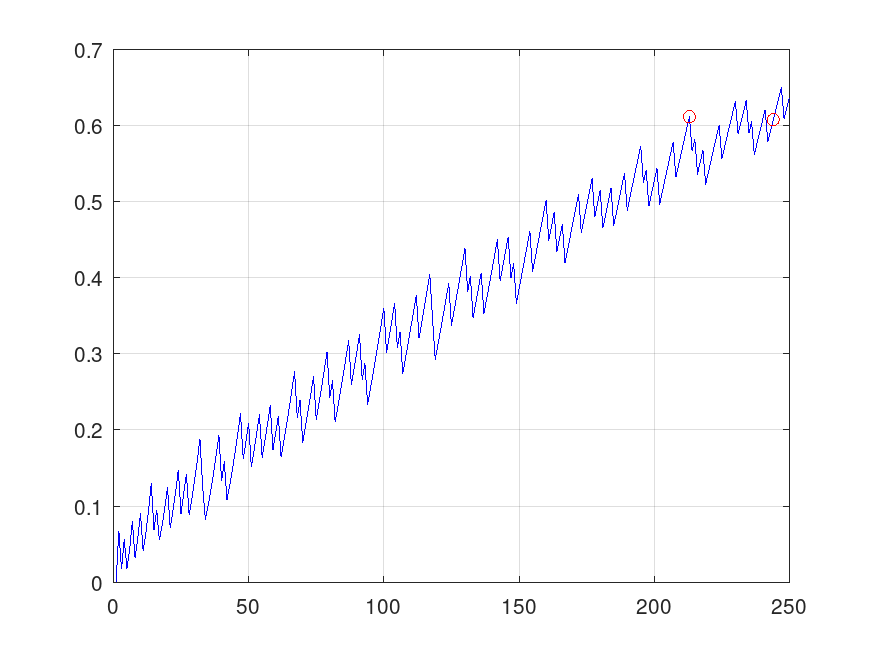
Example: 3
Compute the sample size N required to distinguish p=.26 from p=.2 with a binomial test. The result is approximate, so make a plot to see if any smaller N values also have the required power of 0.6.
 Napprox = sampsizepwr ('p', 0.2, 0.26, 0.6);
 nn = 1:250;
 pwr = sampsizepwr ('p', 0.2, 0.26, [], nn);
 Nexact = min (nn(pwr >= 0.6));
 plot (nn,pwr,'b-', [Napprox Nexact],pwr([Napprox Nexact]),'ro');
 grid on
Example: 4
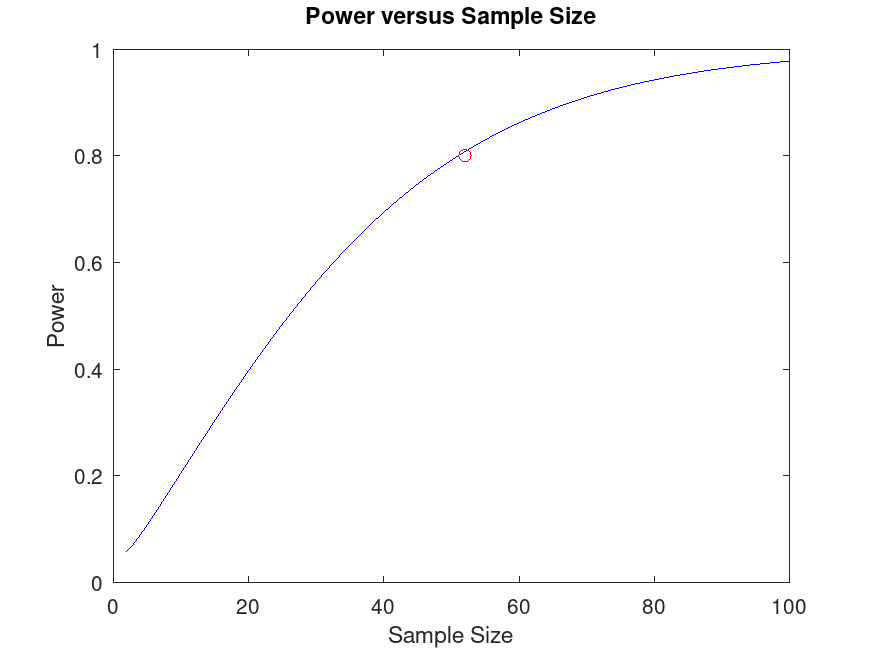
The company must test 52 bottles to detect the difference between a mean volume of 100 mL and 102 mL with a power of 0.80. Generate a power curve to visualize how the sample size affects the power of the test.
 nout = sampsizepwr ('t',[100 5],102,0.80);
 nn = 1:100;
 pwrout = sampsizepwr ('t',[100 5],102,[],nn);
 figure;
 plot (nn, pwrout, 'b-', nout, 0.8, 'ro')
 title ('Power versus Sample Size')
 xlabel ('Sample Size')
 ylabel ('Power')