Categories &
Functions List
- BetaDistribution
- BinomialDistribution
- BirnbaumSaundersDistribution
- BurrDistribution
- ExponentialDistribution
- ExtremeValueDistribution
- GammaDistribution
- GeneralizedExtremeValueDistribution
- GeneralizedParetoDistribution
- HalfNormalDistribution
- InverseGaussianDistribution
- LogisticDistribution
- LoglogisticDistribution
- LognormalDistribution
- LoguniformDistribution
- MultinomialDistribution
- NakagamiDistribution
- NegativeBinomialDistribution
- NormalDistribution
- PiecewiseLinearDistribution
- PoissonDistribution
- RayleighDistribution
- RicianDistribution
- tLocationScaleDistribution
- TriangularDistribution
- UniformDistribution
- WeibullDistribution
- betafit
- betalike
- binofit
- binolike
- bisafit
- bisalike
- burrfit
- burrlike
- evfit
- evlike
- expfit
- explike
- gamfit
- gamlike
- geofit
- gevfit_lmom
- gevfit
- gevlike
- gpfit
- gplike
- gumbelfit
- gumbellike
- hnfit
- hnlike
- invgfit
- invglike
- logifit
- logilike
- loglfit
- logllike
- lognfit
- lognlike
- nakafit
- nakalike
- nbinfit
- nbinlike
- normfit
- normlike
- poissfit
- poisslike
- raylfit
- rayllike
- ricefit
- ricelike
- tlsfit
- tlslike
- unidfit
- unifit
- wblfit
- wbllike
- betacdf
- betainv
- betapdf
- betarnd
- binocdf
- binoinv
- binopdf
- binornd
- bisacdf
- bisainv
- bisapdf
- bisarnd
- burrcdf
- burrinv
- burrpdf
- burrrnd
- bvncdf
- bvtcdf
- cauchycdf
- cauchyinv
- cauchypdf
- cauchyrnd
- chi2cdf
- chi2inv
- chi2pdf
- chi2rnd
- copulacdf
- copulapdf
- copularnd
- evcdf
- evinv
- evpdf
- evrnd
- expcdf
- expinv
- exppdf
- exprnd
- fcdf
- finv
- fpdf
- frnd
- gamcdf
- gaminv
- gampdf
- gamrnd
- geocdf
- geoinv
- geopdf
- geornd
- gevcdf
- gevinv
- gevpdf
- gevrnd
- gpcdf
- gpinv
- gppdf
- gprnd
- gumbelcdf
- gumbelinv
- gumbelpdf
- gumbelrnd
- hncdf
- hninv
- hnpdf
- hnrnd
- hygecdf
- hygeinv
- hygepdf
- hygernd
- invgcdf
- invginv
- invgpdf
- invgrnd
- iwishpdf
- iwishrnd
- jsucdf
- jsupdf
- laplacecdf
- laplaceinv
- laplacepdf
- laplacernd
- logicdf
- logiinv
- logipdf
- logirnd
- loglcdf
- loglinv
- loglpdf
- loglrnd
- logncdf
- logninv
- lognpdf
- lognrnd
- mnpdf
- mnrnd
- mvncdf
- mvnpdf
- mvnrnd
- mvtcdf
- mvtpdf
- mvtrnd
- mvtcdfqmc
- nakacdf
- nakainv
- nakapdf
- nakarnd
- nbincdf
- nbininv
- nbinpdf
- nbinrnd
- ncfcdf
- ncfinv
- ncfpdf
- ncfrnd
- nctcdf
- nctinv
- nctpdf
- nctrnd
- ncx2cdf
- ncx2inv
- ncx2pdf
- ncx2rnd
- normcdf
- norminv
- normpdf
- normrnd
- plcdf
- plinv
- plpdf
- plrnd
- poisscdf
- poissinv
- poisspdf
- poissrnd
- raylcdf
- raylinv
- raylpdf
- raylrnd
- ricecdf
- riceinv
- ricepdf
- ricernd
- tcdf
- tinv
- tpdf
- trnd
- tlscdf
- tlsinv
- tlspdf
- tlsrnd
- tricdf
- triinv
- tripdf
- trirnd
- unidcdf
- unidinv
- unidpdf
- unidrnd
- unifcdf
- unifinv
- unifpdf
- unifrnd
- vmcdf
- vminv
- vmpdf
- vmrnd
- wblcdf
- wblinv
- wblpdf
- wblrnd
- wienrnd
- wishpdf
- wishrnd
- adtest
- anova
- anova1
- anova2
- anovan
- bartlett_test
- barttest
- binotest
- chi2gof
- chi2test
- correlation_test
- fishertest
- friedman
- hotelling_t2test
- hotelling_t2test2
- kruskalwallis
- kstest
- kstest2
- levene_test
- manova1
- mcnemar_test
- multcompare
- ranksum
- regression_ftest
- regression_ttest
- runstest
- sampsizepwr
- signrank
- signtest
- tiedrank
- ttest
- ttest2
- vartest
- vartest2
- vartestn
- ztest
- ztest2
Function Reference: anova1
statistics: p = anova1 (x)
statistics: p = anova1 (x, group)
statistics: p = anova1 (x, group, displayopt)
statistics: p = anova1 (x, group, displayopt, vartype)
statistics: [p, atab] = anova1 (x, …)
statistics: [p, atab, stats] = anova1 (x, …)
Perform a one-way analysis of variance (ANOVA) for comparing the means of two
or more groups of data under the null hypothesis that the groups are drawn
from distributions with the same mean. For planned contrasts and/or
diagnostic plots, use anovan instead.
anova1 can take up to three input arguments:
- x contains the data and it can either be a vector or matrix. If x is a matrix, then each column is treated as a separate group. If x is a vector, then the group argument is mandatory.
- group contains the names for each group. If x is a matrix, then group can either be a cell array of strings of a character array, with one row per column of x. If you want to omit this argument, enter an empty array ([]). If x is a vector, then group must be a vector of the same length, or a string array or cell array of strings with one row for each element of x. x values corresponding to the same value of group are placed in the same group.
- displayopt is an optional parameter for displaying the groups contained in the data in a boxplot. If omitted, it is ’on’ by default. If group names are defined in group, these are used to identify the groups in the boxplot. Use ’off’ to omit displaying this figure.
-
vartype is an optional parameter to used to indicate whether the
groups can be assumed to come from populations with equal variance. When
vartypeis'equal'the variances are assumed to be equal (this is the default). Whenvartypeis'unequal'the population variances are not assumed to be equal and Welch’s ANOVA test is used instead.
anova1 can return up to three output arguments:
- p is the p-value of the null hypothesis that all group means are equal.
- atab is a cell array containing the results in a standard ANOVA table.
- stats is a structure containing statistics useful for performing a multiple comparison of means with the MULTCOMPARE function.
If anova1 is called without any output arguments, then it prints the results in a one-way ANOVA table to the standard output. It is also printed when displayopt is ’on’.
Examples:
x = meshgrid (1:6); x = x + normrnd (0, 1, 6, 6); anova1 (x, [], 'off'); [p, atab] = anova1(x); |
 x = ones (50, 4) .* [-2, 0, 1, 5];
 x = x + normrnd (0, 2, 50, 4);
 groups = {"A", "B", "C", "D"};
 anova1 (x, groups);
|
See also: anova2, anovan, multcompare
Source Code: anova1
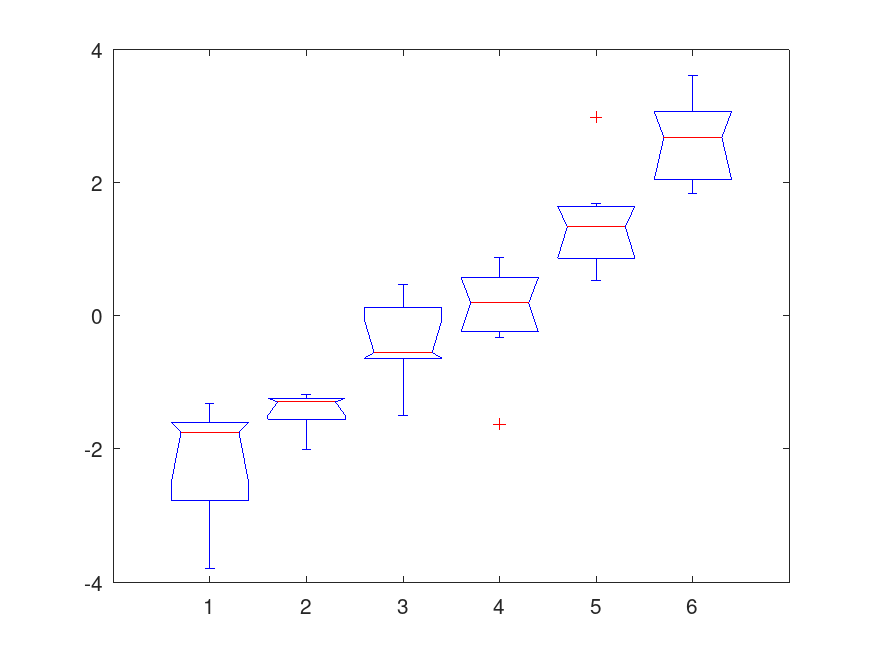
Example: 1
 x = meshgrid (1:6);
 randn ('seed', 15);    # for reproducibility
 x = x + normrnd (0, 1, 6, 6);
 anova1 (x, [], 'off');
                      ANOVA Table

Source        SS      df        MS       F      Prob>F
------------------------------------------------------
Groups     96.8124     5    19.3625    31.76    0.0000
Error      18.2881    30     0.6096
Total     115.1004    35
Example: 2
 x = meshgrid (1:6);
 randn ('seed', 15);    # for reproducibility
 x = x + normrnd (0, 1, 6, 6);
 [p, atab] = anova1 (x);
                      ANOVA Table

Source        SS      df        MS       F      Prob>F
------------------------------------------------------
Groups     96.8124     5    19.3625    31.76    0.0000
Error      18.2881    30     0.6096
Total     115.1004    35
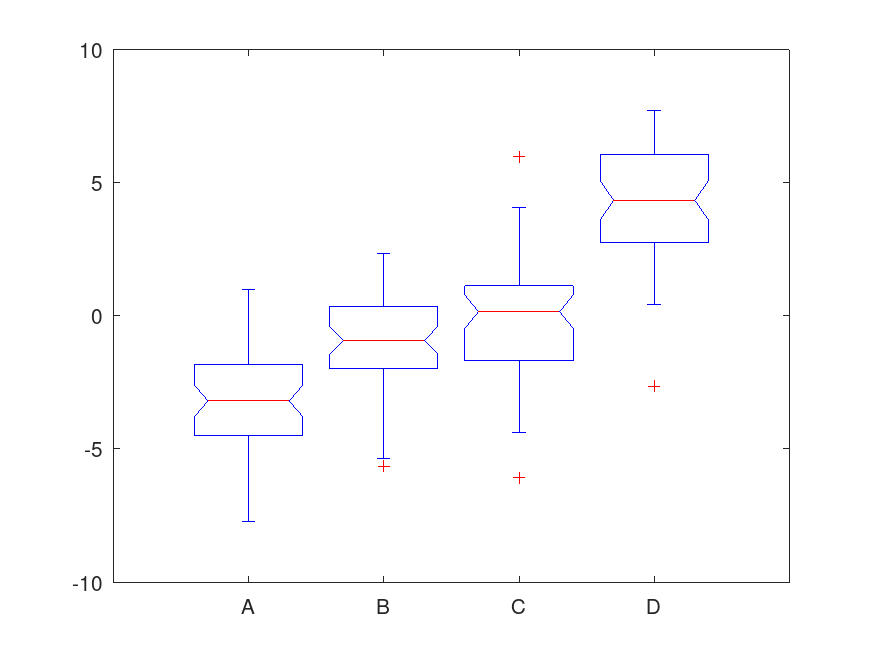
Example: 3
 x = ones (50, 4) .* [-2, 0, 1, 5];
 randn ('seed', 13);    # for reproducibility
 x = x + normrnd (0, 2, 50, 4);
 groups = {'A', 'B', 'C', 'D'};
 anova1 (x, groups);
                      ANOVA Table

Source        SS      df        MS       F      Prob>F
------------------------------------------------------
Groups   1392.4448     3   464.1483   105.41    0.0000
Error     863.0487   196     4.4033
Total    2255.4935   199
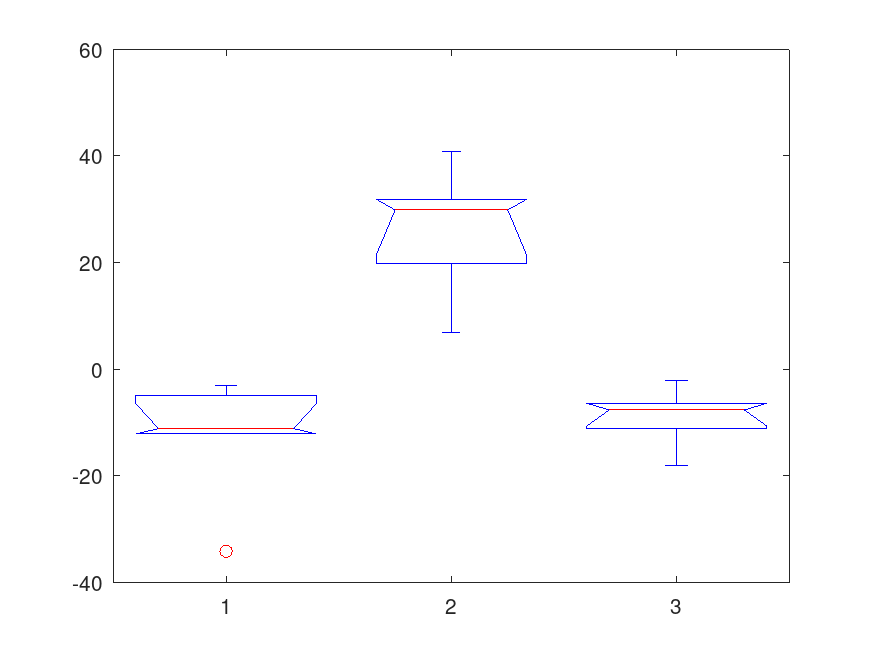
Example: 4
 y = [54 87 45; 23 98 39; 45 64 51; 54 77 49; 45 89 50; 47 NaN 55];
 g = [1  2  3 ; 1  2  3 ; 1  2  3 ; 1  2  3 ; 1  2  3 ; 1  2  3 ];
 anova1 (y(:), g(:), 'on', 'unequal');
           Welch's ANOVA Table

Source        F     df     dfe     Prob>F
-----------------------------------------
Groups     15.52     2    7.58     0.0021