Categories &
Functions List
- BetaDistribution
- BinomialDistribution
- BirnbaumSaundersDistribution
- BurrDistribution
- ExponentialDistribution
- ExtremeValueDistribution
- GammaDistribution
- GeneralizedExtremeValueDistribution
- GeneralizedParetoDistribution
- HalfNormalDistribution
- InverseGaussianDistribution
- LogisticDistribution
- LoglogisticDistribution
- LognormalDistribution
- LoguniformDistribution
- MultinomialDistribution
- NakagamiDistribution
- NegativeBinomialDistribution
- NormalDistribution
- PiecewiseLinearDistribution
- PoissonDistribution
- RayleighDistribution
- RicianDistribution
- tLocationScaleDistribution
- TriangularDistribution
- UniformDistribution
- WeibullDistribution
- betafit
- betalike
- binofit
- binolike
- bisafit
- bisalike
- burrfit
- burrlike
- evfit
- evlike
- expfit
- explike
- gamfit
- gamlike
- geofit
- gevfit_lmom
- gevfit
- gevlike
- gpfit
- gplike
- gumbelfit
- gumbellike
- hnfit
- hnlike
- invgfit
- invglike
- logifit
- logilike
- loglfit
- logllike
- lognfit
- lognlike
- nakafit
- nakalike
- nbinfit
- nbinlike
- normfit
- normlike
- poissfit
- poisslike
- raylfit
- rayllike
- ricefit
- ricelike
- tlsfit
- tlslike
- unidfit
- unifit
- wblfit
- wbllike
- betacdf
- betainv
- betapdf
- betarnd
- binocdf
- binoinv
- binopdf
- binornd
- bisacdf
- bisainv
- bisapdf
- bisarnd
- burrcdf
- burrinv
- burrpdf
- burrrnd
- bvncdf
- bvtcdf
- cauchycdf
- cauchyinv
- cauchypdf
- cauchyrnd
- chi2cdf
- chi2inv
- chi2pdf
- chi2rnd
- copulacdf
- copulapdf
- copularnd
- evcdf
- evinv
- evpdf
- evrnd
- expcdf
- expinv
- exppdf
- exprnd
- fcdf
- finv
- fpdf
- frnd
- gamcdf
- gaminv
- gampdf
- gamrnd
- geocdf
- geoinv
- geopdf
- geornd
- gevcdf
- gevinv
- gevpdf
- gevrnd
- gpcdf
- gpinv
- gppdf
- gprnd
- gumbelcdf
- gumbelinv
- gumbelpdf
- gumbelrnd
- hncdf
- hninv
- hnpdf
- hnrnd
- hygecdf
- hygeinv
- hygepdf
- hygernd
- invgcdf
- invginv
- invgpdf
- invgrnd
- iwishpdf
- iwishrnd
- jsucdf
- jsupdf
- laplacecdf
- laplaceinv
- laplacepdf
- laplacernd
- logicdf
- logiinv
- logipdf
- logirnd
- loglcdf
- loglinv
- loglpdf
- loglrnd
- logncdf
- logninv
- lognpdf
- lognrnd
- mnpdf
- mnrnd
- mvncdf
- mvnpdf
- mvnrnd
- mvtcdf
- mvtpdf
- mvtrnd
- mvtcdfqmc
- nakacdf
- nakainv
- nakapdf
- nakarnd
- nbincdf
- nbininv
- nbinpdf
- nbinrnd
- ncfcdf
- ncfinv
- ncfpdf
- ncfrnd
- nctcdf
- nctinv
- nctpdf
- nctrnd
- ncx2cdf
- ncx2inv
- ncx2pdf
- ncx2rnd
- normcdf
- norminv
- normpdf
- normrnd
- plcdf
- plinv
- plpdf
- plrnd
- poisscdf
- poissinv
- poisspdf
- poissrnd
- raylcdf
- raylinv
- raylpdf
- raylrnd
- ricecdf
- riceinv
- ricepdf
- ricernd
- tcdf
- tinv
- tpdf
- trnd
- tlscdf
- tlsinv
- tlspdf
- tlsrnd
- tricdf
- triinv
- tripdf
- trirnd
- unidcdf
- unidinv
- unidpdf
- unidrnd
- unifcdf
- unifinv
- unifpdf
- unifrnd
- vmcdf
- vminv
- vmpdf
- vmrnd
- wblcdf
- wblinv
- wblpdf
- wblrnd
- wienrnd
- wishpdf
- wishrnd
- adtest
- anova
- anova1
- anova2
- anovan
- bartlett_test
- barttest
- binotest
- chi2gof
- chi2test
- correlation_test
- fishertest
- friedman
- hotelling_t2test
- hotelling_t2test2
- kruskalwallis
- kstest
- kstest2
- levene_test
- manova1
- mcnemar_test
- multcompare
- ranksum
- regression_ftest
- regression_ttest
- runstest
- sampsizepwr
- signrank
- signtest
- tiedrank
- ttest
- ttest2
- vartest
- vartest2
- vartestn
- ztest
- ztest2
Function Reference: knnsearch
statistics: idx = knnsearch (X, Y)
statistics: [idx, D] = knnsearch (X, Y)
statistics: […] = knnsearch (…, name, value)
Find k-nearest neighbors from input data.
idx = knnsearch (X, Y) finds nearest
neighbors in X for Y. It returns idx which contains indices
of nearest neighbors of each row of Y, If not specified,
K = 1. X must be an numeric matrix of input
data, where rows correspond to observations and columns correspond to
features or variables. Y is an numeric matrix with query
points, which must have the same numbers of column as X.
[idx, D] = knnsearch (X, Y) also returns the
the distances, D, which correspond to the nearest neighbour in
X for each Y
Additional parameters can be specified by Name-Value pair arguments.
| Name | Value | |
|---|---|---|
'K' | is the number of nearest neighbors to be found in the kNN search. It must be a positive integer value and by default it is 1. | |
'P' | is the Minkowski distance exponent and it must be
a positive scalar. This argument is only valid when the selected distance
metric is 'minkowski'. By default it is 2. | |
'Scale' | is the scale parameter for the standardized
Euclidean distance and it must be a nonnegative numeric vector of equal
length to the number of columns in X. This argument is only valid when
the selected distance metric is 'seuclidean', in which case each
coordinate of X is scaled by the corresponding element of
'scale', as is each query point in Y. By default, the scale
parameter is the standard deviation of each coordinate in X. | |
'Cov' | is the covariance matrix for computing the
mahalanobis distance and it must be a positive definite matrix matching the
the number of columns in X. This argument is only valid when the
selected distance metric is 'mahalanobis'. | |
'BucketSize' | is the maximum number of data points in
the leaf node of the Kd-tree and it must be a positive integer. This
argument is only valid when the selected search method is 'kdtree'. | |
'SortIndices' | is a boolean flag to sort the returned
indices in ascending order by distance and it is true by default.
When the selected search method is 'exhaustive' or the
'IncludeTies' flag is true, knnsearch always sorts the
returned indices. | |
'Distance' | is the distance metric used by
knnsearch as specified below: |
'euclidean' | Euclidean distance. | |
'seuclidean' | standardized Euclidean distance. Each
coordinate difference between the rows in X and the query matrix
Y is scaled by dividing by the corresponding element of the standard
deviation computed from X. To specify a different scaling, use the
'Scale' name-value argument. | |
'cityblock' | City block distance. | |
'chebychev' | Chebychev distance (maximum coordinate difference). | |
'minkowski' | Minkowski distance. The default exponent
is 2. To specify a different exponent, use the 'P' name-value
argument. | |
'mahalanobis' | Mahalanobis distance, computed using a
positive definite covariance matrix. To change the value of the covariance
matrix, use the 'Cov' name-value argument. | |
'cosine' | Cosine distance. | |
'correlation' | One minus the sample linear correlation between observations (treated as sequences of values). | |
'spearman' | One minus the sample Spearman’s rank correlation between observations (treated as sequences of values). | |
'hamming' | Hamming distance, which is the percentage of coordinates that differ. | |
'jaccard' | One minus the Jaccard coefficient, which is the percentage of nonzero coordinates that differ. | |
| @distfun | Custom distance function handle. A distance
function of the form function D2 = distfun (XI, YI),
where XI is a vector containing a single observation in
-dimensional space, YI is an matrix containing an
arbitrary number of observations in the same -dimensional space, and
D2 is an vector of distances, where (D2k) is
the distance between observations XI and (YIk,:). |
'NSMethod' | is the nearest neighbor search method used
by knnsearch as specified below. |
'kdtree' | Creates and uses a Kd-tree to find nearest
neighbors. 'kdtree' is the default value when the number of columns
in X is less than or equal to 10, X is not sparse, and the
distance metric is 'euclidean', 'cityblock',
'manhattan', 'chebychev', or 'minkowski'. Otherwise,
the default value is 'exhaustive'. This argument is only valid when
the distance metric is one of the four aforementioned metrics. | |
'exhaustive' | Uses the exhaustive search algorithm by computing the distance values from all the points in X to each point in Y. |
'IncludeTies' | is a boolean flag to indicate if the
returned values should contain the indices that have same distance as the
neighbor. When false, knnsearch chooses the
observation with the smallest index among the observations that have the same
distance from a query point. When true, knnsearch includes
all nearest neighbors whose distances are equal to the smallest
distance in the output arguments. To specify , use the 'K'
name-value pair argument. |
See also: rangesearch, pdist2, fitcknn
Source Code: knnsearch
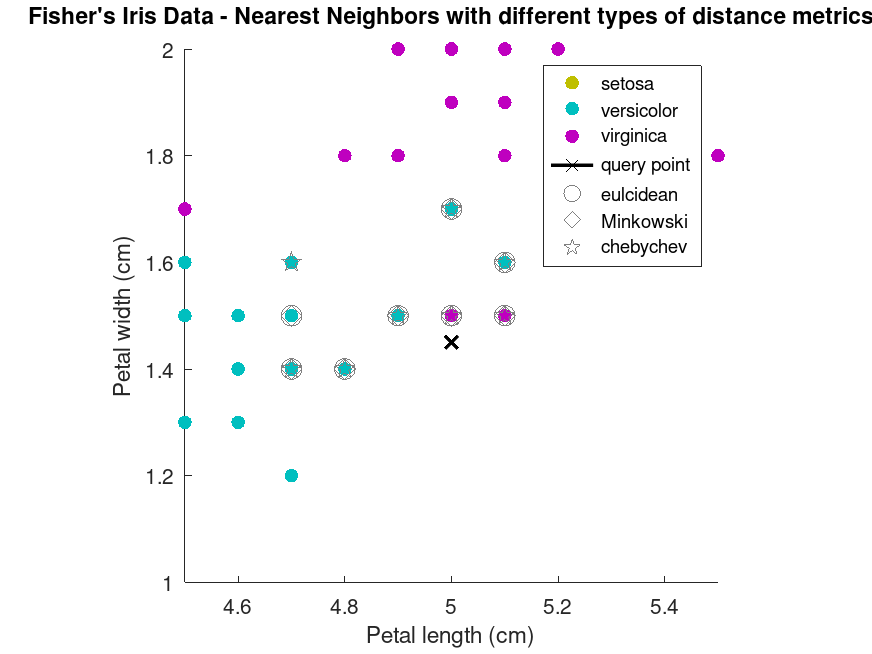
Example: 1
find 10 nearest neighbour of a point using different distance metrics and compare the results by plotting
 load fisheriris
 X = meas(:,3:4);
 Y = species;
 point = [5, 1.45];
calculate 10 nearest-neighbours by minkowski distance
[id, d] = knnsearch (X, point, 'K', 10);
calculate 10 nearest-neighbours by minkowski distance
[idm, dm] = knnsearch (X, point, 'K', 10, 'distance', 'minkowski', 'p', 5);
calculate 10 nearest-neighbours by chebychev distance
[idc, dc] = knnsearch (X, point, 'K', 10, 'distance', 'chebychev');
plotting the results
 gscatter (X(:,1), X(:,2), species, [.75 .75 0; 0 .75 .75; .75 0 .75], '.', 20);
 title ('Fisher''s Iris Data - Nearest Neighbors with different types of distance metrics');
 xlabel ('Petal length (cm)');
 ylabel ('Petal width (cm)');
 line (point(1), point(2), 'marker', 'X', 'color', 'k', ...
       'linewidth', 2, 'displayname', 'query point')
 line (X(id,1), X(id,2), 'color', [0.5 0.5 0.5], 'marker', 'o', ...
       'linestyle', 'none', 'markersize', 10, 'displayname', 'euclidean')
 line (X(idm,1), X(idm,2), 'color', [0.5 0.5 0.5], 'marker', 'd', ...
       'linestyle', 'none', 'markersize', 10, 'displayname', 'Minkowski')
 line (X(idc,1), X(idc,2), 'color', [0.5 0.5 0.5], 'marker', 'p', ...
       'linestyle', 'none', 'markersize', 10, 'displayname', 'chebychev')
 xlim ([4.5 5.5]);
 ylim ([1 2]);
 axis square;
Example: 2
knnsearch on iris dataset using kdtree method
 load fisheriris
 X = meas(:,3:4);
 gscatter (X(:,1), X(:,2), species, [.75 .75 0; 0 .75 .75; .75 0 .75], '.', 20);
 title ('Fisher''s iris dataset : Nearest Neighbors with kdtree search');
new point to be predicted
 point = [5 1.45];
 line (point(1), point(2), 'marker', 'X', 'color', 'k', ...
       'linewidth', 2, 'displayname', 'query point')
knnsearch using kdtree method
[idx, d] = knnsearch (X, point, 'K', 10, 'NSMethod', 'kdtree');
plotting predicted neighbours
 line (X(idx,1), X(idx,2), 'color', [0.5 0.5 0.5], 'marker', 'o', ...
       'linestyle', 'none', 'markersize', 10, ...
       'displayname', 'nearest neighbour')
 xlim ([4 6])
 ylim ([1 3])
 axis square
details of predicted labels
tabulate (species(idx))
  2x3 table

        Value         Count    Percent
    ______________    _____    _______

    {'virginica' }        2         20
    {'versicolor'}        8         80
 ctr = point - d(end);
 diameter = 2 * d(end);
Draw a circle around the 10 nearest neighbors.
h = rectangle ('position', [ctr, diameter, diameter], 'curvature', [1 1]);
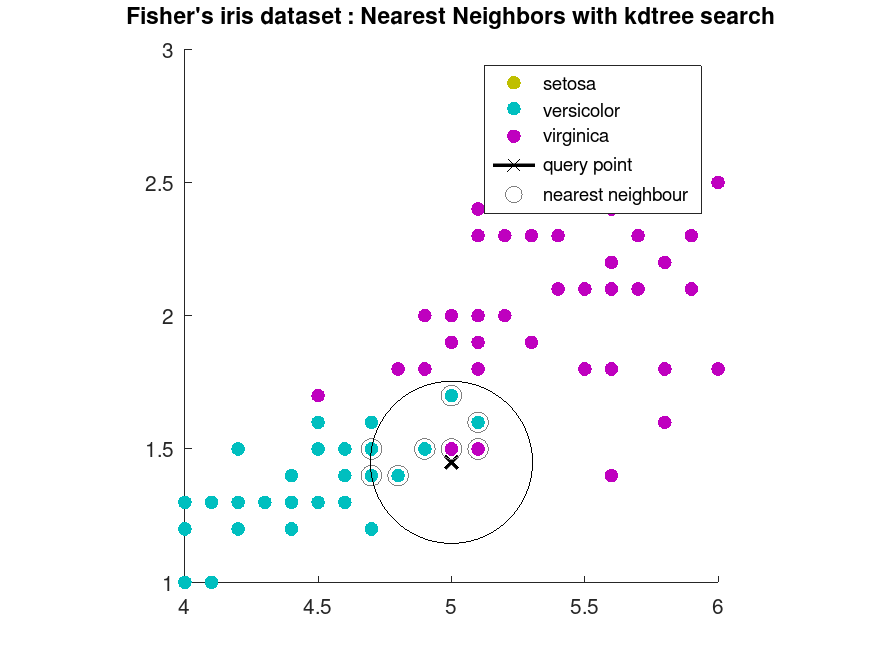
here only 8 neighbours are plotted instead of 10 since the dataset contains duplicate values