Categories &
Functions List
- BetaDistribution
- BinomialDistribution
- BirnbaumSaundersDistribution
- BurrDistribution
- ExponentialDistribution
- ExtremeValueDistribution
- GammaDistribution
- GeneralizedExtremeValueDistribution
- GeneralizedParetoDistribution
- HalfNormalDistribution
- InverseGaussianDistribution
- LogisticDistribution
- LoglogisticDistribution
- LognormalDistribution
- LoguniformDistribution
- MultinomialDistribution
- NakagamiDistribution
- NegativeBinomialDistribution
- NormalDistribution
- PiecewiseLinearDistribution
- PoissonDistribution
- RayleighDistribution
- RicianDistribution
- tLocationScaleDistribution
- TriangularDistribution
- UniformDistribution
- WeibullDistribution
- betafit
- betalike
- binofit
- binolike
- bisafit
- bisalike
- burrfit
- burrlike
- evfit
- evlike
- expfit
- explike
- gamfit
- gamlike
- geofit
- gevfit_lmom
- gevfit
- gevlike
- gpfit
- gplike
- gumbelfit
- gumbellike
- hnfit
- hnlike
- invgfit
- invglike
- logifit
- logilike
- loglfit
- logllike
- lognfit
- lognlike
- nakafit
- nakalike
- nbinfit
- nbinlike
- normfit
- normlike
- poissfit
- poisslike
- raylfit
- rayllike
- ricefit
- ricelike
- tlsfit
- tlslike
- unidfit
- unifit
- wblfit
- wbllike
- betacdf
- betainv
- betapdf
- betarnd
- binocdf
- binoinv
- binopdf
- binornd
- bisacdf
- bisainv
- bisapdf
- bisarnd
- burrcdf
- burrinv
- burrpdf
- burrrnd
- bvncdf
- bvtcdf
- cauchycdf
- cauchyinv
- cauchypdf
- cauchyrnd
- chi2cdf
- chi2inv
- chi2pdf
- chi2rnd
- copulacdf
- copulapdf
- copularnd
- evcdf
- evinv
- evpdf
- evrnd
- expcdf
- expinv
- exppdf
- exprnd
- fcdf
- finv
- fpdf
- frnd
- gamcdf
- gaminv
- gampdf
- gamrnd
- geocdf
- geoinv
- geopdf
- geornd
- gevcdf
- gevinv
- gevpdf
- gevrnd
- gpcdf
- gpinv
- gppdf
- gprnd
- gumbelcdf
- gumbelinv
- gumbelpdf
- gumbelrnd
- hncdf
- hninv
- hnpdf
- hnrnd
- hygecdf
- hygeinv
- hygepdf
- hygernd
- invgcdf
- invginv
- invgpdf
- invgrnd
- iwishpdf
- iwishrnd
- jsucdf
- jsupdf
- laplacecdf
- laplaceinv
- laplacepdf
- laplacernd
- logicdf
- logiinv
- logipdf
- logirnd
- loglcdf
- loglinv
- loglpdf
- loglrnd
- logncdf
- logninv
- lognpdf
- lognrnd
- mnpdf
- mnrnd
- mvncdf
- mvnpdf
- mvnrnd
- mvtcdf
- mvtpdf
- mvtrnd
- mvtcdfqmc
- nakacdf
- nakainv
- nakapdf
- nakarnd
- nbincdf
- nbininv
- nbinpdf
- nbinrnd
- ncfcdf
- ncfinv
- ncfpdf
- ncfrnd
- nctcdf
- nctinv
- nctpdf
- nctrnd
- ncx2cdf
- ncx2inv
- ncx2pdf
- ncx2rnd
- normcdf
- norminv
- normpdf
- normrnd
- plcdf
- plinv
- plpdf
- plrnd
- poisscdf
- poissinv
- poisspdf
- poissrnd
- raylcdf
- raylinv
- raylpdf
- raylrnd
- ricecdf
- riceinv
- ricepdf
- ricernd
- tcdf
- tinv
- tpdf
- trnd
- tlscdf
- tlsinv
- tlspdf
- tlsrnd
- tricdf
- triinv
- tripdf
- trirnd
- unidcdf
- unidinv
- unidpdf
- unidrnd
- unifcdf
- unifinv
- unifpdf
- unifrnd
- vmcdf
- vminv
- vmpdf
- vmrnd
- wblcdf
- wblinv
- wblpdf
- wblrnd
- wienrnd
- wishpdf
- wishrnd
- adtest
- anova
- anova1
- anova2
- anovan
- bartlett_test
- barttest
- binotest
- chi2gof
- chi2test
- correlation_test
- fishertest
- friedman
- hotelling_t2test
- hotelling_t2test2
- kruskalwallis
- kstest
- kstest2
- levene_test
- manova1
- mcnemar_test
- multcompare
- ranksum
- regression_ftest
- regression_ttest
- runstest
- sampsizepwr
- signrank
- signtest
- tiedrank
- ttest
- ttest2
- vartest
- vartest2
- vartestn
- ztest
- ztest2
Class Definition: ExhaustiveSearcher
statistics: ExhaustiveSearcher
Exhaustive nearest neighbor searcher
The ExhaustiveSearcher class implements an exhaustive search
algorithm for nearest neighbor queries. It stores training data and
supports various distance metrics along with their parameter values for
performing an exhaustive search. The exhaustive search algorithm computes
the distance from each query point to all the points in the training data
and facilitates a nearest neighbor search using knnsearch or a
radius search using rangesearch.
You can either use the ExhaustiveSearcher class constructor or the
createns function to create an ExhaustiveSearcher object.
See also: createns, KDTreeSearcher, hnswSearcher, knnsearch, rangesearch
Source Code: ExhaustiveSearcher
The ExhaustiveSearcher class contains the following properties:
Point data, specified as an numeric matrix where each row is an observation and each column is a feature. This property is private and cannot be modified after object creation.
Distance metric used for searches, specified as a character vector (e.g.,
'euclidean', 'minkowski') or a function handle to a
custom distance function. Default is 'euclidean'. Supported
metrics align with those in pdist2.
The type and value of the distance parameter depends on the selected
Distance metric and can be any of the following:
- For
'minkowski', a positive scalar exponent (default 2). - For
'seuclidean', a nonnegative vector of scaling factors matching the number of columns inX(default is standard deviation ofX). - For
'mahalanobis', a positive definite covariance matrix matching the dimensions ofX(default iscov (X)). - Empty for other metrics or custom functions.
The ExhaustiveSearcher class offers the following public methods:
ExhaustiveSearcher: obj = ExhaustiveSearcher (X)
ExhaustiveSearcher: obj = ExhaustiveSearcher (X, name, value)
obj = ExhaustiveSearcher (X) constructs an
ExhaustiveSearcher object with training data X using the
default 'euclidean' distance metric. X must be an
numeric matrix, where rows represent observations and columns
represent features.
obj = ExhaustiveSearcher (X, name, value)
allows customization through name-value pairs:
| Name | Value | |
|---|---|---|
'Distance' | Distance metric, specified as a
character vector (e.g., 'euclidean', 'minkowski') or a
function handle. Default is 'euclidean'. See pdist2 for
supported metrics. | |
'P' | a positive scalar specifying the exponent for
the Minkowski distance. Valid only when 'Distance' is
'minkowski'. Default is 2. | |
'Scale' | a nonnegative vector with the same number
of elements as the columns in X specifying the scale parameter for
the standardized Euclidean distance. Valid only when
'Distance' is 'seuclidean'. Default is std (X). | |
'Cov' | a positive definite matrix matching the
number of columns in X specifying the covariance matrix for the
Mahalanobis distance. Valid only when 'Distance' is
'mahalanobis'. Default is cov (X). |
See also: ExhaustiveSearcher, knnsearch, rangesearch, pdist2
ExhaustiveSearcher: [idx, D] = knnsearch (obj, Y)
ExhaustiveSearcher: [idx, D] = knnsearch (obj, Y, name, value)
[idx, D] = knnsearch (obj, Y) returns the
indices idx and distances D of the nearest neighbor in
obj.X to each point in Y, using the distance metric specified
in obj.Distance.
- obj is an
ExhaustiveSearcherobject. - Y is an numeric matrix of query points, where must match the number of columns in obj.X.
[idx, D] = knnsearch (obj, Y, name,
 value)
allows additional options via name-value pairs:
| Name | Value | |
|---|---|---|
'K' | A positive integer specifying the number of nearest neighbors to find. Default is 1. | |
'IncludeTies' | Logical flag indicating whether to
include all neighbors tied with the th smallest distance. Default
is false. If true, idx and D are cell arrays. |
idx contains the indices of the nearest neighbors in obj.X. D contains the corresponding distances.
See also: ExhaustiveSearcher, rangesearch, pdist2
ExhaustiveSearcher: [idx, D] = rangesearch (obj, Y, r)
ExhaustiveSearcher: [idx, D] = rangesearch (obj, Y, r, name, value)
[idx, D] = rangesearch (obj, Y, r)
returns the indices idx and distances D of all points in
obj.X within radius r of each point in Y, using the
distance metric specified in obj.Distance.
- obj is an
ExhaustiveSearcherobject. - Y is an numeric matrix of query points, where must match the number of columns in obj.X.
- r is a nonnegative scalar specifying the search radius.
[idx, D] = rangesearch (…, name,
 value)
allows additional options via name-value pairs:
| Name | Value | |
|---|---|---|
'SortIndices' | Logical flag indicating whether to
sort the indices by distance. Default is true. |
idx and D are cell arrays where each cell contains the indices and distances for one query point in Y.
See also: ExhaustiveSearcher, knnsearch, pdist2
Examples
 load fisheriris
 rng ('default');
 numSamples = size (meas, 1);
 queryIndices = [20, 95, 123, 136, 138];
 dataPoints = meas(! ismember (1:numSamples, queryIndices), :);
 queryPoints = meas(queryIndices, :);
 searchModel = ExhaustiveSearcher (dataPoints, 'Distance', 'mahalanobis')
searchModel =

  ExhaustiveSearcher with properties:

                 Distance: 'mahalanobis'
            DistParameter: [4x4 double]
                        X: [145x4 double]
mahalanobisParam = searchModel.DistParameter
mahalanobisParam =

   0.654708  -0.036803   1.231971   0.502620
  -0.036803   0.191363  -0.322715  -0.119293
   1.231971  -0.322715   3.067148   1.284234
   0.502620  -0.119293   1.284234   0.579984
 searchRadius = 3;
 nearestNeighbors = knnsearch (searchModel, queryPoints, 'K', 2)
nearestNeighbors =

     5     6
    98    95
   104   128
   135    65
   102   115
neighborsInRange = rangesearch (searchModel, queryPoints, searchRadius)
neighborsInRange =
  5x1 cell array

Columns 1 through 1:

    {[5 6 21 46 48 44 37 22 1 8 11 27 26 33 18 12 39 7 40 49 32 47 19 3 28 29 17 20 43 23 42 16 30 4 56 34 85 24 10 51 38 61 13 88 14 35 25 ... ]}
    {[  98 95 83 88 78 89 55 63 69 91 94 90 82 92 59 80 100 138 131 57 66 67 81 61 125 102 115 145 134 96 110 118 126 93 4 53 64 29 30 72 9 ... ]}
    {[                     104 128 127 106 117 123 58 52 76 50 107 86 74 101 65 75 77 131 96 72 54 73 115 129 51 63 67 91 71 87 110 92 62 118 82]}
    {[                    135 65 75 101 111 117 77 54 50 86 137 52 76 119 141 128 74 71 121 142 143 136 58 124 51 109 110 104 68 87 96 31 36 139]}
    {[ 102 115 91 94 63 56 145 83 88 95 55 131 66 85 122 78 70 103 125 73 98 84 134 123 51 90 126 67 100 138 61 96 139 110 107 24 44 101 12 ... ]}
 X = [1, 2; 3, 4; 5, 6];
 obj = ExhaustiveSearcher (X);
Find the nearest neighbor to [2, 3]
 Y = [2, 3];
 [idx, D] = knnsearch (obj, Y);
 disp ('Nearest neighbor index:'); disp (idx);
Nearest neighbor index:
1
disp ('Distance:'); disp (D);
Distance:
1.4142
Find all points within radius 2
 [idx, D] = rangesearch (obj, Y, 2);
 disp ('Indices within radius:'); disp (idx);
Indices within radius:
  1x1 cell array

    {[1 2]}
disp ('Distances:'); disp (D);
Distances:
  1x1 cell array

    {[1.41421 1.41421]}
 X = [0, 0; 1, 0; 0, 1];
 obj = ExhaustiveSearcher (X, 'Distance', 'minkowski', 'P', 1);
Find the 2 nearest neighbors to [0.5, 0.5]
 Y = [0.5, 0.5];
 [idx, D] = knnsearch (obj, Y, 'K', 2);
 disp ('Nearest neighbor indices:'); disp (idx);
Nearest neighbor indices:
   1   2
disp ('Distances:'); disp (D);
Distances:
   1   1
 rng (42);
 disp ('Demonstrating ExhaustiveSearcher');
Demonstrating ExhaustiveSearcher
 n = 100;
 mu1 = [0.3, 0.3];
 mu2 = [0.7, 0.7];
 sigma = 0.1;
 X1 = mu1 + sigma * randn (n/2, 2);
 X2 = mu2 + sigma * randn (n/2, 2);
 X = [X1; X2];
 obj = ExhaustiveSearcher (X);
 Y = [0.3, 0.3; 0.7, 0.7; 0.5, 0.5];
 K = 5;
 [idx, D] = knnsearch (obj, Y, 'K', K);
 disp ('For the first query point:');
For the first query point:
disp (['Query point: ', num2str(Y(1,:))]);
Query point: 0.3 0.3
disp ('Indices of nearest neighbors:');
Indices of nearest neighbors:
disp (idx(1,:));
49 19 14 46 34
disp ('Distances:');
Distances:
disp (D(1,:));
0.029932 0.040026 0.046845 0.051107 0.054789
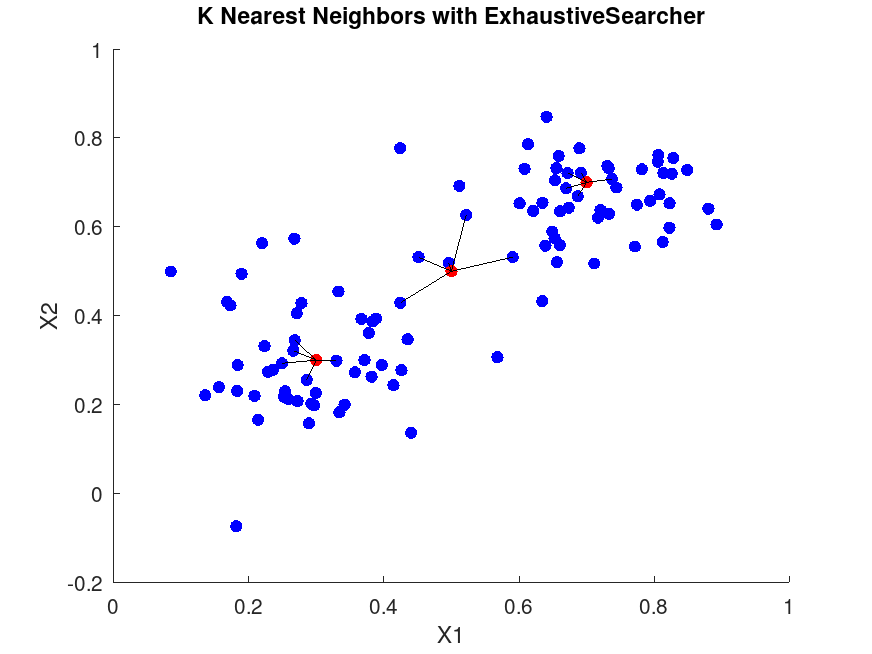
 figure;
 scatter (X(:,1), X(:,2), 36, 'b', 'filled'); % Training points
 hold on;
 scatter (Y(:,1), Y(:,2), 36, 'r', 'filled'); % Query points
 for i = 1:size (Y,1)
     query = Y(i,:);
     neighbors = X(idx(i,:), :);
     for j = 1:K
         plot ([query(1), neighbors(j,1)], [query(2), neighbors(j,2)], 'k-');
     endfor
 endfor
 hold off;
 title ('K Nearest Neighbors with ExhaustiveSearcher');
 xlabel ('X1');
 ylabel ('X2');
 r = 0.15;
 [idx, D] = rangesearch (obj, Y, r);
 disp ('For the first query point in rangesearch:');
For the first query point in rangesearch:
disp (['Query point: ', num2str(Y(1,:))]);
Query point: 0.3 0.3
disp ('Indices of points within radius:');
Indices of points within radius:
disp (idx{1});
 Columns 1 through 29:

   49   19   14   46   34   23   12   41    1    3   42   48   24    2   11   37   10   27   32   20   44   40   39   21    7   31   45   30    4

 Columns 30 through 34:

   16   47    9   29    8
disp ('Distances:');
Distances:
disp (D{1});
 Columns 1 through 13:

   0.029932   0.040026   0.046845   0.051107   0.054789   0.063517   0.067855   0.071365   0.073769   0.075991   0.082686   0.084066   0.090008

 Columns 14 through 26:

   0.095171   0.096337   0.096836   0.097593   0.098255   0.098948   0.101780   0.108652   0.108983   0.114272   0.116760   0.120198   0.121721

 Columns 27 through 34:

   0.122560   0.127342   0.128062   0.128687   0.130208   0.136007   0.142870   0.143009
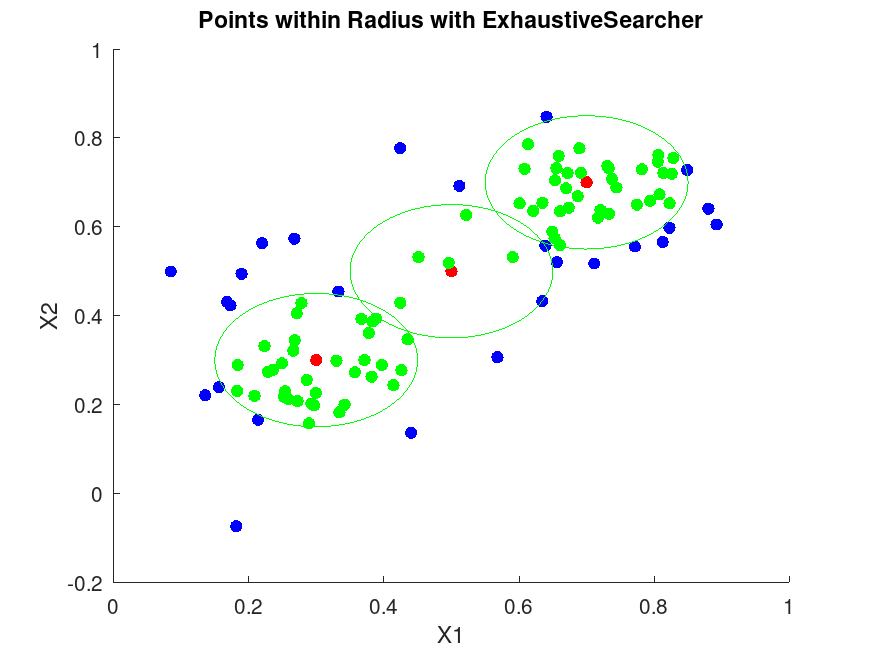
 figure;
 scatter (X(:,1), X(:,2), 36, 'b', 'filled');
 hold on;
 scatter (Y(:,1), Y(:,2), 36, 'r', 'filled');
 theta = linspace (0, 2*pi, 100);
 for i = 1:size (Y,1)
     center = Y(i,:);
     x_circle = center(1) + r * cos (theta);
     y_circle = center(2) + r * sin (theta);
     plot (x_circle, y_circle, 'g-');
     % Highlight points within radius
     if ! isempty (idx{i})
         in_radius = X(idx{i}, :);
         scatter (in_radius(:,1), in_radius(:,2), 36, 'g', 'filled');
     endif
 endfor
 hold off;
 title ('Points within Radius with ExhaustiveSearcher');
 xlabel ('X1');
 ylabel ('X2');