Categories &
Functions List
- adtest
- anova
- anova1
- anova2
- anovan
- ansaribradley
- barttest
- binotest
- chi2gof
- chi2test
- correlation_test
- detectdrift
- dwtest
- fishertest
- friedman
- hotelling_t2test
- hotelling_t2test2
- jbtest
- knntest
- kruskalwallis
- kstest
- kstest2
- lillietest
- manova1
- mcnemar_test
- meanEffectSize
- mmdtest
- multcompare
- ranksum
- regression_ftest
- regression_ttest
- runstest
- signrank
- signtest
- stats.drift.DriftDiagnostics
- swtest
- ttest
- ttest2
- vartest
- vartest2
- vartestn
- ztest
- ztest2
- CompactLinearModel
- CoxModel
- coxphfit
- fitcox
- fitglm
- fitglme
- fitlm
- fitlme
- fitlmematrix
- fitnlm
- fitrm
- GeneralizedLinearMixedModel
- GeneralizedLinearModel
- glmfit
- glmval
- invpred
- lasso
- lassoglm
- LinearFormula
- LinearMixedModel
- LinearModel
- logistic_regression
- mnrfit
- mnrval
- monotone_smooth
- mvregress
- mvregresslike
- nlinfit
- nlparci
- nlpredci
- NonLinearModel
- plsregress
- regress
- regress_gp
- RepeatedMeasuresModel
- ridge
- robustfit
- stepwisefit
- stepwiseglm
- stepwiselm
- ClassificationBaggedEnsemble
- ClassificationDiscriminant
- ClassificationECOC
- ClassificationEnsemble
- ClassificationGAM
- ClassificationKernel
- ClassificationKNN
- ClassificationLinear
- ClassificationNaiveBayes
- ClassificationNeuralNetwork
- ClassificationPartitionedECOC
- ClassificationPartitionedEnsemble
- ClassificationPartitionedKernel
- ClassificationPartitionedLinear
- ClassificationPartitionedModel
- ClassificationSVM
- ClassificationTree
- CompactClassificationDiscriminant
- CompactClassificationECOC
- CompactClassificationEnsemble
- CompactClassificationGAM
- CompactClassificationNaiveBayes
- CompactClassificationNeuralNetwork
- CompactClassificationSVM
- CompactClassificationTree
- CompactRegressionGAM
- CompactRegressionEnsemble
- CompactRegressionGP
- CompactRegressionNeuralNetwork
- CompactRegressionSVM
- CompactRegressionTree
- CompactTreeBagger
- designecoc
- fcnnpredict
- fcnntrain
- fitcdiscr
- fitcecoc
- fitcensemble
- fitcgam
- fitckernel
- fitcknn
- fitclinear
- fitcnb
- fitcnet
- fitcsvm
- fitctree
- fitrensemble
- fitrgam
- fitrgp
- fitrkernel
- fitrlinear
- fitrnet
- fitrsvm
- fitrtree
- gamboostinter
- gamboostpairs
- gamboostpredict
- gamboosttrain
- gampredict
- gamtrain
- partialDependence
- plotPartialDependence
- PredictiveModel
- RegressionBaggedEnsemble
- RegressionEnsemble
- RegressionGAM
- RegressionGP
- RegressionKernel
- RegressionLinear
- RegressionNeuralNetwork
- RegressionPartitionedEnsemble
- RegressionPartitionedKernel
- RegressionPartitionedLinear
- RegressionPartitionedModel
- RegressionSVM
- RegressionTree
- lime
- shapley
- svmpredict
- svmtrain
- templateDiscriminant
- templateEnsemble
- templateKernel
- templateKNN
- templateLinear
- templateNaiveBayes
- templateSVM
- templateTree
- TreeBagger
- treepredict
- treetrain
- paretotails
- prob.ProbabilityDistribution
- prob.BetaDistribution
- prob.BinomialDistribution
- prob.BirnbaumSaundersDistribution
- prob.BurrDistribution
- prob.ExponentialDistribution
- prob.ExtremeValueDistribution
- prob.GammaDistribution
- prob.GeneralizedExtremeValueDistribution
- prob.GeneralizedParetoDistribution
- prob.HalfNormalDistribution
- prob.InverseGaussianDistribution
- prob.KernelDistribution
- prob.LogisticDistribution
- prob.LoglogisticDistribution
- prob.LognormalDistribution
- prob.LoguniformDistribution
- prob.MultinomialDistribution
- prob.NakagamiDistribution
- prob.NegativeBinomialDistribution
- prob.NormalDistribution
- prob.PiecewiseLinearDistribution
- prob.PoissonDistribution
- prob.RayleighDistribution
- prob.RicianDistribution
- prob.StableDistribution
- prob.tLocationScaleDistribution
- prob.TriangularDistribution
- prob.UniformDistribution
- prob.WeibullDistribution
- betafit
- betalike
- binofit
- binolike
- bisafit
- bisalike
- burrfit
- burrlike
- copulafit
- evfit
- evlike
- expfit
- explike
- gamfit
- gamlike
- geofit
- gevfit
- gevlike
- gevfit_lmom
- gpfit
- gplike
- gumbelfit
- gumbellike
- hnfit
- hnlike
- invgfit
- invglike
- logifit
- logilike
- loglfit
- logllike
- lognfit
- lognlike
- nakafit
- nakalike
- nbinfit
- nbinlike
- normfit
- normlike
- poissfit
- poisslike
- raylfit
- rayllike
- ricefit
- ricelike
- stblfit
- stbllike
- tlsfit
- tlslike
- unidfit
- unifit
- wblfit
- wbllike
- betacdf
- betainv
- betapdf
- betarnd
- binocdf
- binoinv
- binopdf
- binornd
- bisacdf
- bisainv
- bisapdf
- bisarnd
- burrcdf
- burrinv
- burrpdf
- burrrnd
- bvncdf
- bvtcdf
- cauchycdf
- cauchyinv
- cauchypdf
- cauchyrnd
- chi2cdf
- chi2inv
- chi2pdf
- chi2rnd
- copulacdf
- copulapdf
- copularnd
- evcdf
- evinv
- evpdf
- evrnd
- expcdf
- expinv
- exppdf
- exprnd
- fcdf
- finv
- fpdf
- frnd
- gamcdf
- gaminv
- gampdf
- gamrnd
- geocdf
- geoinv
- geopdf
- geornd
- gevcdf
- gevinv
- gevpdf
- gevrnd
- gpcdf
- gpinv
- gppdf
- gprnd
- gumbelcdf
- gumbelinv
- gumbelpdf
- gumbelrnd
- hncdf
- hninv
- hnpdf
- hnrnd
- hygecdf
- hygeinv
- hygepdf
- hygernd
- invgcdf
- invginv
- invgpdf
- invgrnd
- iwishpdf
- iwishrnd
- jsucdf
- jsupdf
- laplacecdf
- laplaceinv
- laplacepdf
- laplacernd
- logicdf
- logiinv
- logipdf
- logirnd
- loglcdf
- loglinv
- loglpdf
- loglrnd
- logncdf
- logninv
- lognpdf
- lognrnd
- mnpdf
- mnrnd
- mvncdf
- mvnpdf
- mvnrnd
- mvtcdf
- mvtpdf
- mvtrnd
- nakacdf
- nakainv
- nakapdf
- nakarnd
- nbincdf
- nbininv
- nbinpdf
- nbinrnd
- ncfcdf
- ncfinv
- ncfpdf
- ncfrnd
- nctcdf
- nctinv
- nctpdf
- nctrnd
- ncx2cdf
- ncx2inv
- ncx2pdf
- ncx2rnd
- normcdf
- norminv
- normpdf
- normrnd
- plcdf
- plinv
- plpdf
- plrnd
- poisscdf
- poissinv
- poisspdf
- poissrnd
- raylcdf
- raylinv
- raylpdf
- raylrnd
- ricecdf
- riceinv
- ricepdf
- ricernd
- stblcdf
- stblinv
- stblpdf
- stblrnd
- stdrcdf
- stdrinv
- stdrpdf
- stdrrnd
- tcdf
- tinv
- tpdf
- trnd
- tlscdf
- tlsinv
- tlspdf
- tlsrnd
- tricdf
- triinv
- tripdf
- trirnd
- unidcdf
- unidinv
- unidpdf
- unidrnd
- unifcdf
- unifinv
- unifpdf
- unifrnd
- vmcdf
- vminv
- vmpdf
- vmrnd
- wblcdf
- wblinv
- wblpdf
- wblrnd
- wienrnd
- wishpdf
- wishrnd
- betastat
- binostat
- bisastat
- burrstat
- chi2stat
- copulaparam
- copulastat
- evstat
- expstat
- fstat
- gamstat
- geostat
- gevstat
- gpstat
- gumbelstat
- hnstat
- hygestat
- invgstat
- logistat
- loglstat
- lognstat
- nakastat
- nbinstat
- ncfstat
- nctstat
- ncx2stat
- normstat
- plstat
- poisstat
- raylstat
- ricestat
- stdrstat
- tlsstat
- tristat
- tstat
- unidstat
- unifstat
- wblstat
- andrewsplot
- bar3
- bar3h
- biplot
- boxchart
- boxplot
- cdfplot
- dendrogram
- ecdfhist
- einstein
- gardnerAltmanPlot
- glyphplot
- gplotmatrix
- gscatter
- heatmap
- hist3
- histfit
- manovacluster
- normplot
- parallelcoords
- parallelplot
- ppplot
- probplot
- qqplot
- scatterhist
- scatterhistogram
- silhouette
- stats.chart.BoxChart
- stats.chart.HeatmapChart
- stats.chart.ParallelCoordinatesPlot
- stats.chart.ScatterHistogramChart
- swarmchart
- violin
- wblplot
Class Definition: prob.KernelDistribution
statistics: prob.KernelDistribution
Kernel probability distribution object.
A prob.KernelDistribution object consists of a nonparametric kernel
smoothing density estimate fitted to sample data, together with a model
description. Unlike the parametric distribution objects, it has no
estimated parameters; the fitted distribution is defined entirely by the
data, the smoothing kernel, and the bandwidth.
A prob.KernelDistribution object can only be created by fitting a
kernel smoothing distribution to data with the fitdist function.
Unlike the parametric distributions, it cannot be created with the
makedist function, since it is not parametric and requires data.
Further information about the kernel density estimation can be found at https://en.wikipedia.org/wiki/Kernel_density_estimation
See also: fitdist, ksdensity, mvksdensity
Source Code: prob.KernelDistribution
The prob.KernelDistribution class contains the following properties:
A character vector specifying the name of the probability distribution object. This property is read-only.
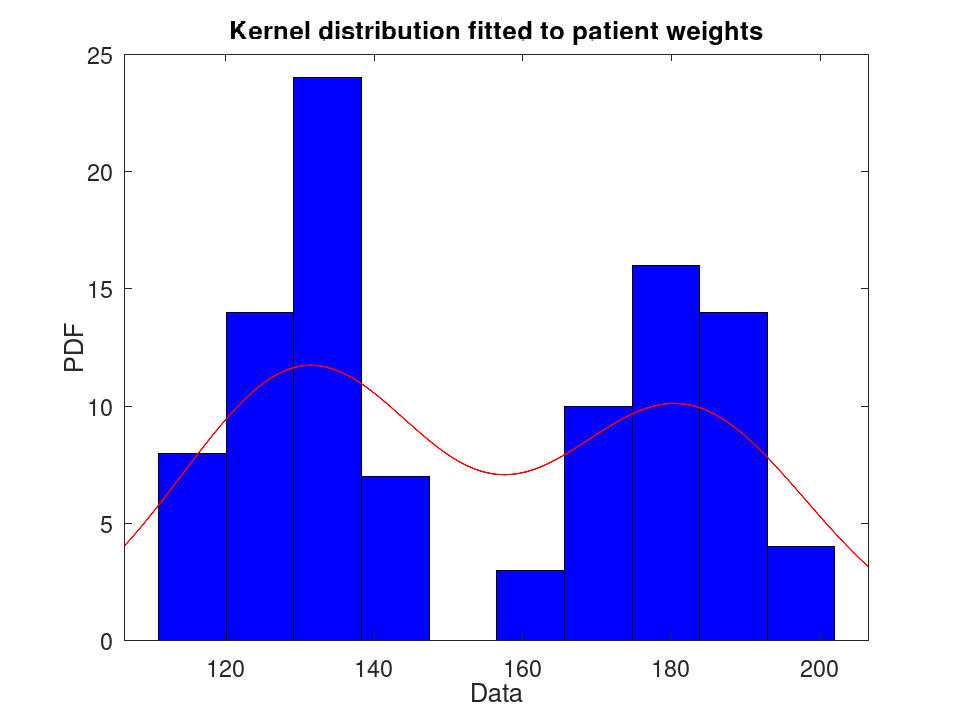
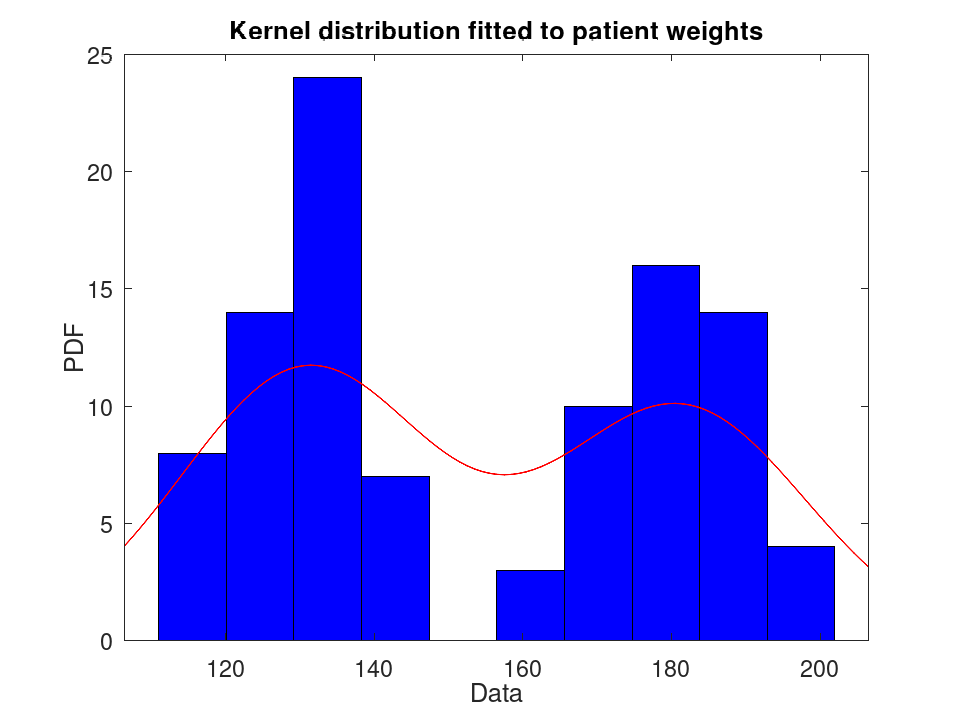
Fit a kernel distribution to a sample and plot its PDF over a histogram.
 load patients
 pd = fitdist (Weight, 'Kernel');
 plot (pd)
 title ('Kernel distribution fitted to patient weights')
A character vector specifying the type of smoothing kernel used for the
density estimate. It is one of 'normal', 'box',
'triangle', or 'epanechnikov'. You can access the
Kernel property using dot name assignment.
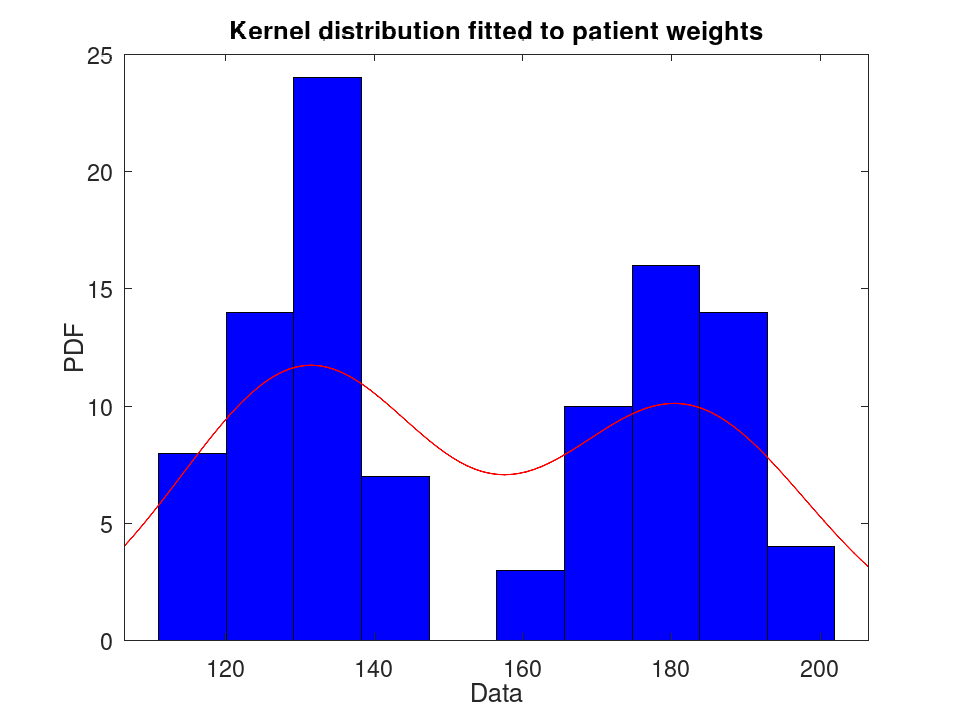
Fit a kernel distribution to a sample and plot its PDF over a histogram.
 load patients
 pd = fitdist (Weight, 'Kernel');
 plot (pd)
 title ('Kernel distribution fitted to patient weights')
A positive scalar value specifying the bandwidth of the smoothing kernel.
You can access the Bandwidth property using dot name assignment.
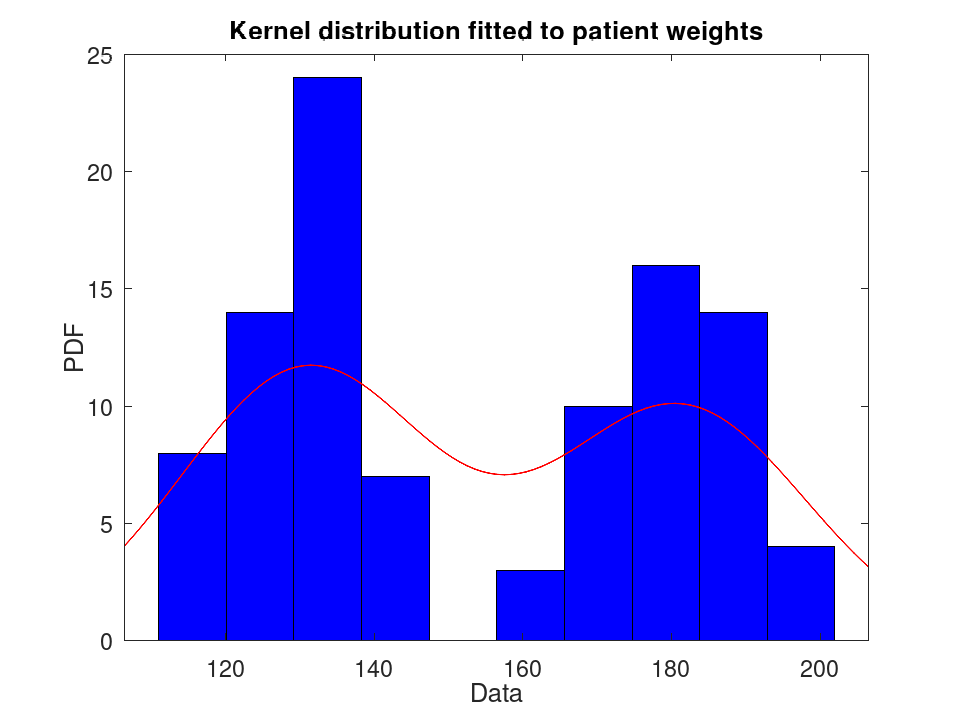
Fit a kernel distribution to a sample and plot its PDF over a histogram.
 load patients
 pd = fitdist (Weight, 'Kernel');
 plot (pd)
 title ('Kernel distribution fitted to patient weights')
A scalar structure containing the following fields:
-
range: either the character vector'unbounded'or'positive', or a two-element numeric vector [L, U] with the lower and upper bounds of the support. -
closedbound: a two-element logical vector specifying whether each bound is closed. -
iscontinuous: a logical scalar, alwaystruefor a kernel distribution.
This property is read-only.
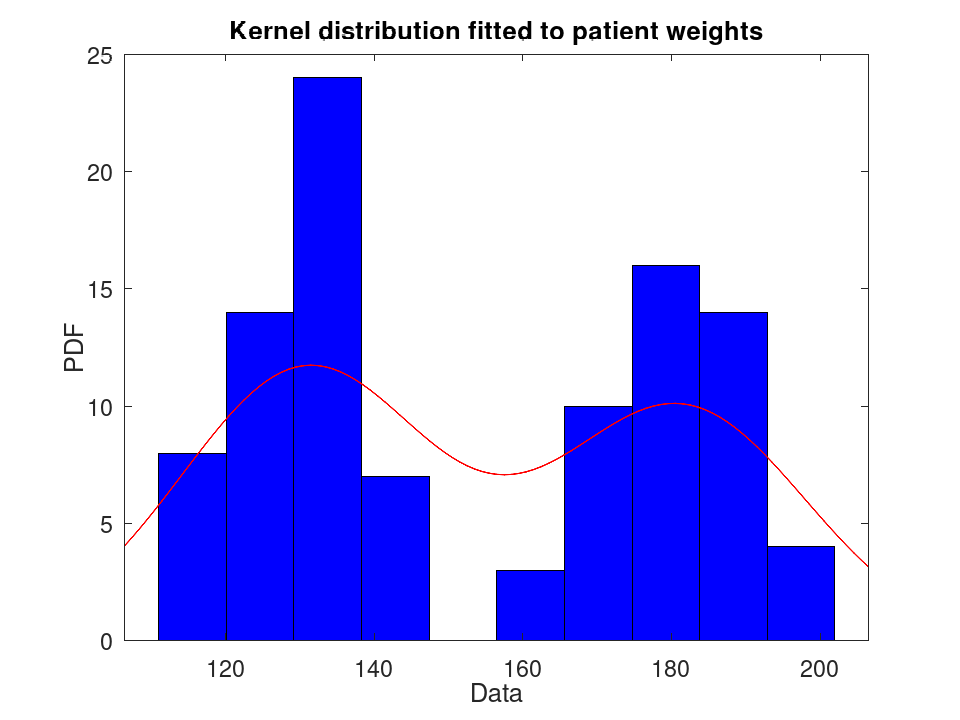
Fit a kernel distribution to a sample and plot its PDF over a histogram.
 load patients
 pd = fitdist (Weight, 'Kernel');
 plot (pd)
 title ('Kernel distribution fitted to patient weights')
A 1×2 numeric vector specifying the truncation interval for the
probability distribution. First element contains the lower boundary,
second element contains the upper boundary. This property is read-only.
You can only truncate a probability distribution with the
truncate method.
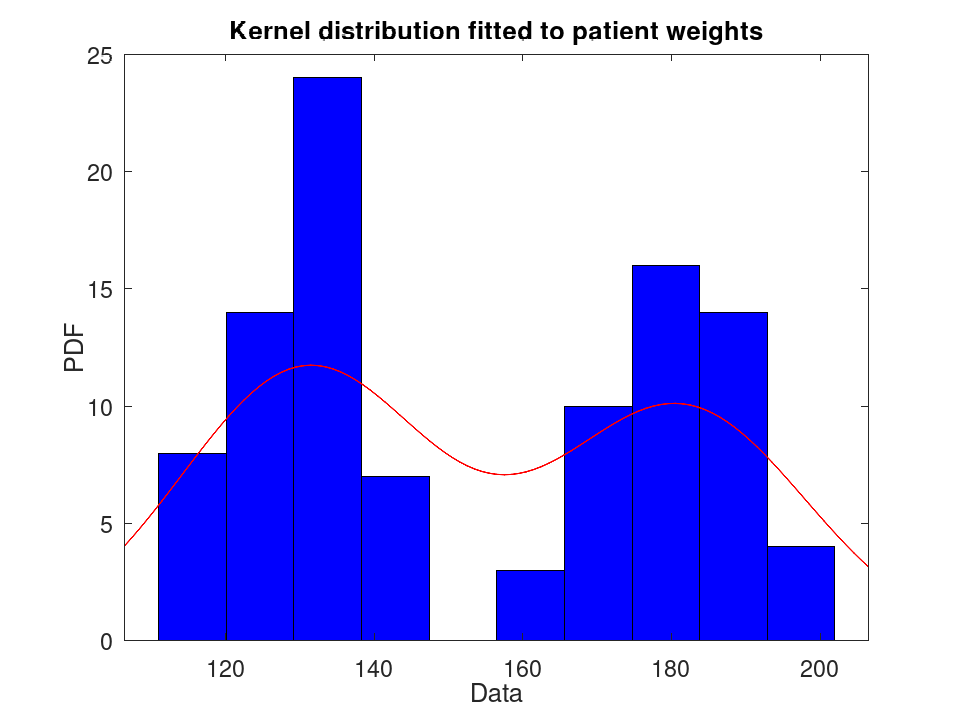
Fit a kernel distribution to a sample and plot its PDF over a histogram.
 load patients
 pd = fitdist (Weight, 'Kernel');
 plot (pd)
 title ('Kernel distribution fitted to patient weights')
A logical scalar value specifying whether a probability distribution is truncated or not. This property is read-only.
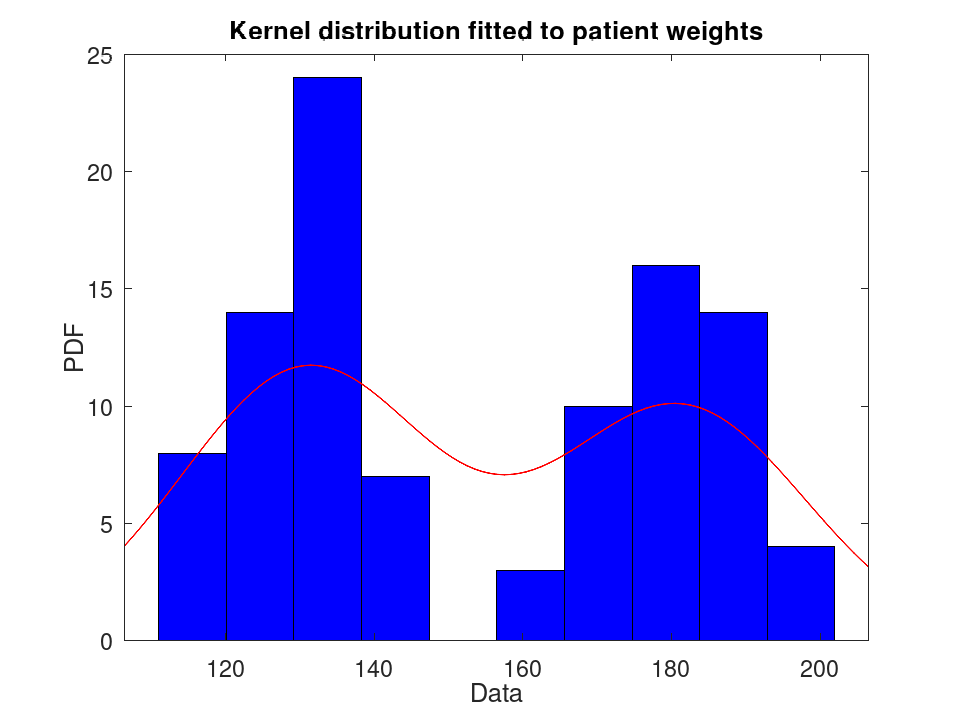
Fit a kernel distribution to a sample and plot its PDF over a histogram.
 load patients
 pd = fitdist (Weight, 'Kernel');
 plot (pd)
 title ('Kernel distribution fitted to patient weights')
A scalar structure containing the following fields:
-
data: a numeric vector containing the data used for distribution fitting. -
cens: an empty array, since censoring is not supported for a kernel distribution. -
freq: a numeric vector of non-negative integer values containing the frequency information corresponding to the elements of the data used for distribution fitting. If no frequency vector was used for distribution fitting, then this field defaults to an empty array.
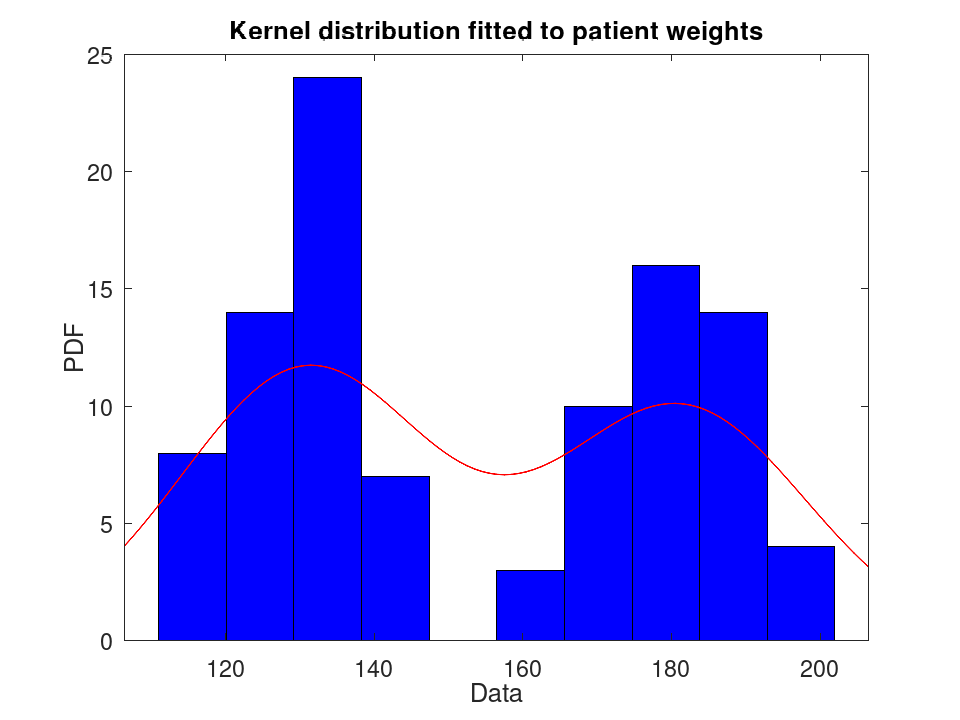
Fit a kernel distribution to a sample and plot its PDF over a histogram.
 load patients
 pd = fitdist (Weight, 'Kernel');
 plot (pd)
 title ('Kernel distribution fitted to patient weights')
The prob.KernelDistribution class offers the following public methods:
prob.KernelDistribution: p = cdf (pd, x)
prob.KernelDistribution: p = cdf (pd, x, 'upper')
p = cdf (pd, x) computes the CDF of the
probability distribution object, pd, evaluated at the values in
x.
p = cdf (…, returns the complement of
the CDF of the probability distribution object, pd, evaluated at
the values in x.
'upper')
x must be double or single; integer, logical, and
character arrays are rejected.
Fit a kernel distribution to a sample and plot its PDF over a histogram.
 load patients
 pd = fitdist (Weight, 'Kernel');
 plot (pd)
 title ('Kernel distribution fitted to patient weights')
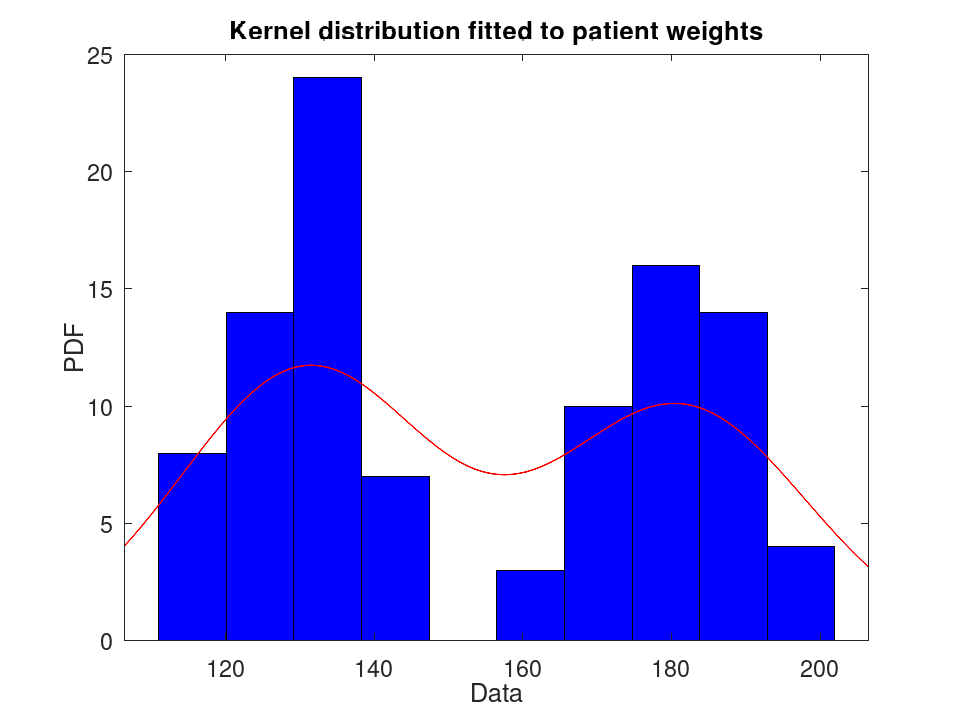
prob.KernelDistribution: x = icdf (pd, p)
x = icdf (pd, p) computes the quantile (the
inverse of the CDF) of the probability distribution object, pd,
evaluated at the values in p.
p must be double or single; integer, logical, and
character arrays are rejected.
Fit a kernel distribution to a sample and plot its PDF over a histogram.
 load patients
 pd = fitdist (Weight, 'Kernel');
 plot (pd)
 title ('Kernel distribution fitted to patient weights')
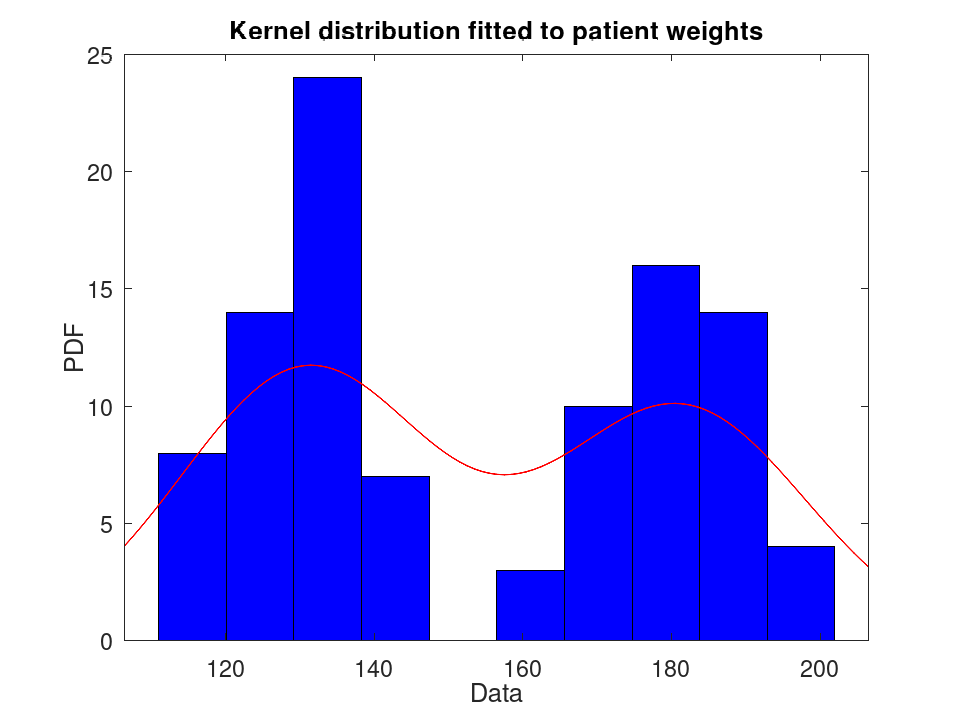
prob.KernelDistribution: r = iqr (pd)
r = iqr (pd) computes the interquartile range of the
probability distribution object, pd.
Fit a kernel distribution to a sample and plot its PDF over a histogram.
 load patients
 pd = fitdist (Weight, 'Kernel');
 plot (pd)
 title ('Kernel distribution fitted to patient weights')
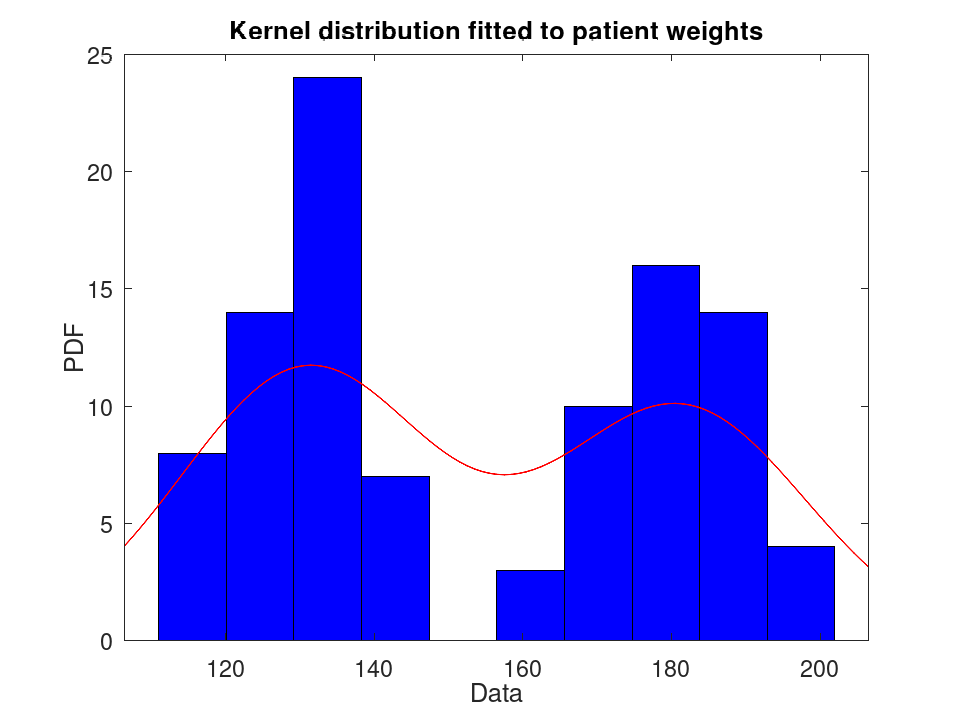
prob.KernelDistribution: m = mean (pd)
m = mean (pd) computes the mean of the probability
distribution object, pd.
Fit a kernel distribution to a sample and plot its PDF over a histogram.
 load patients
 pd = fitdist (Weight, 'Kernel');
 plot (pd)
 title ('Kernel distribution fitted to patient weights')
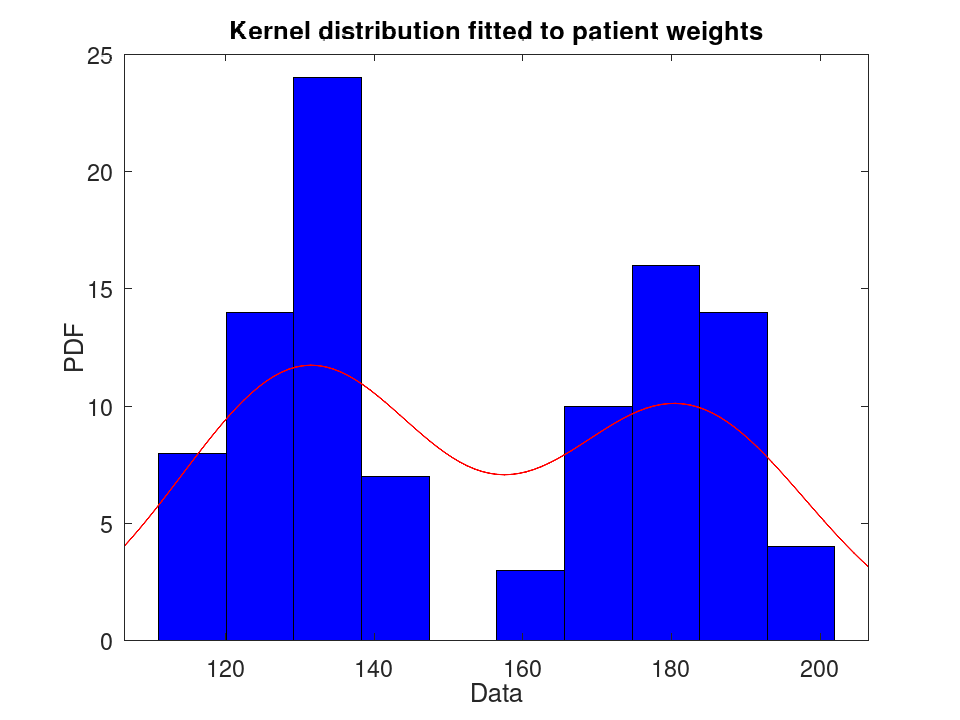
prob.KernelDistribution: m = median (pd)
m = median (pd) computes the median of the probability
distribution object, pd.
Fit a kernel distribution to a sample and plot its PDF over a histogram.
 load patients
 pd = fitdist (Weight, 'Kernel');
 plot (pd)
 title ('Kernel distribution fitted to patient weights')
prob.KernelDistribution: nlogL = negloglik (pd)
nlogL = negloglik (pd) computes the negative
loglikelihood of the probability distribution object, pd.
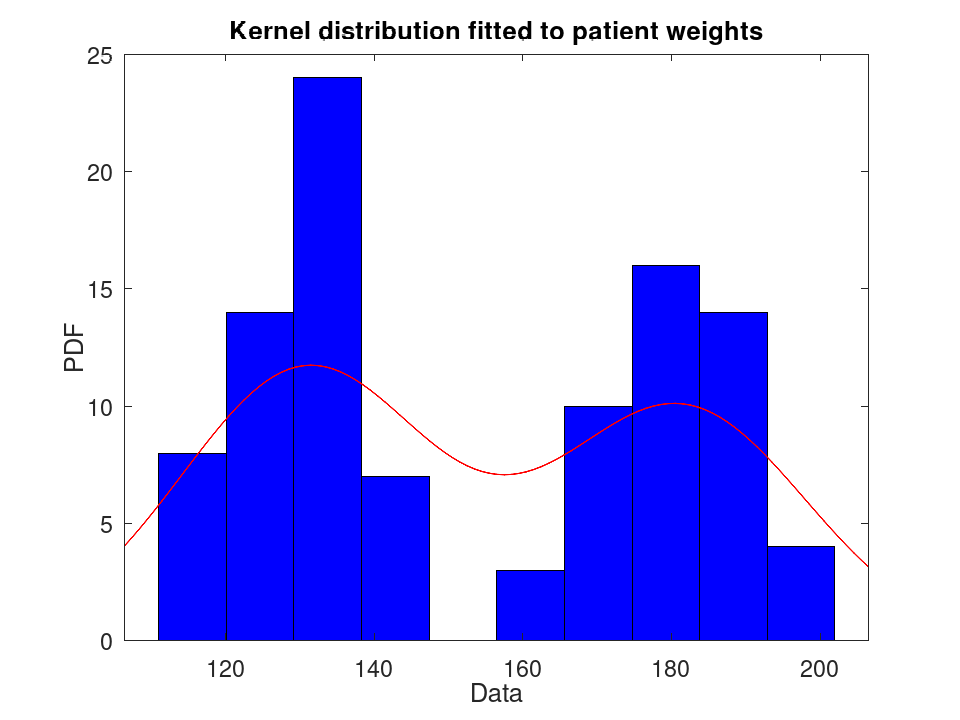
Fit a kernel distribution to a sample and plot its PDF over a histogram.
 load patients
 pd = fitdist (Weight, 'Kernel');
 plot (pd)
 title ('Kernel distribution fitted to patient weights')
prob.KernelDistribution: y = pdf (pd, x)
y = pdf (pd, x) computes the PDF of the
probability distribution object, pd, evaluated at the values in
x.
x must be double or single; integer, logical, and
character arrays are rejected.
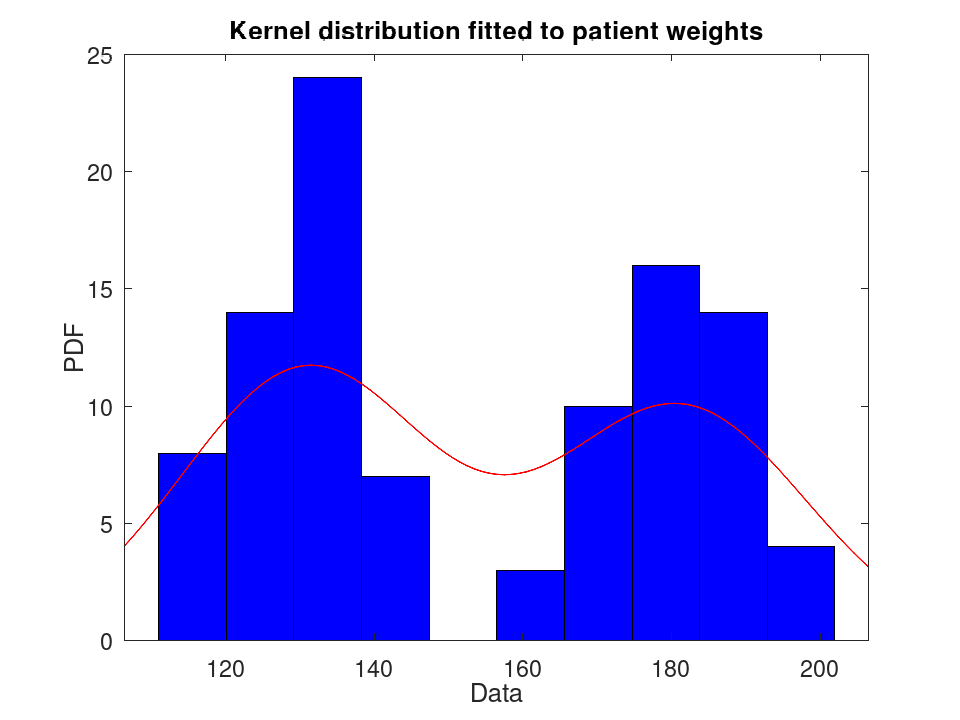
Fit a kernel distribution to a sample and plot its PDF over a histogram.
 load patients
 pd = fitdist (Weight, 'Kernel');
 plot (pd)
 title ('Kernel distribution fitted to patient weights')
prob.KernelDistribution: plot (pd)
prob.KernelDistribution: plot (pd, Name, Value)
prob.KernelDistribution: h = plot (…)
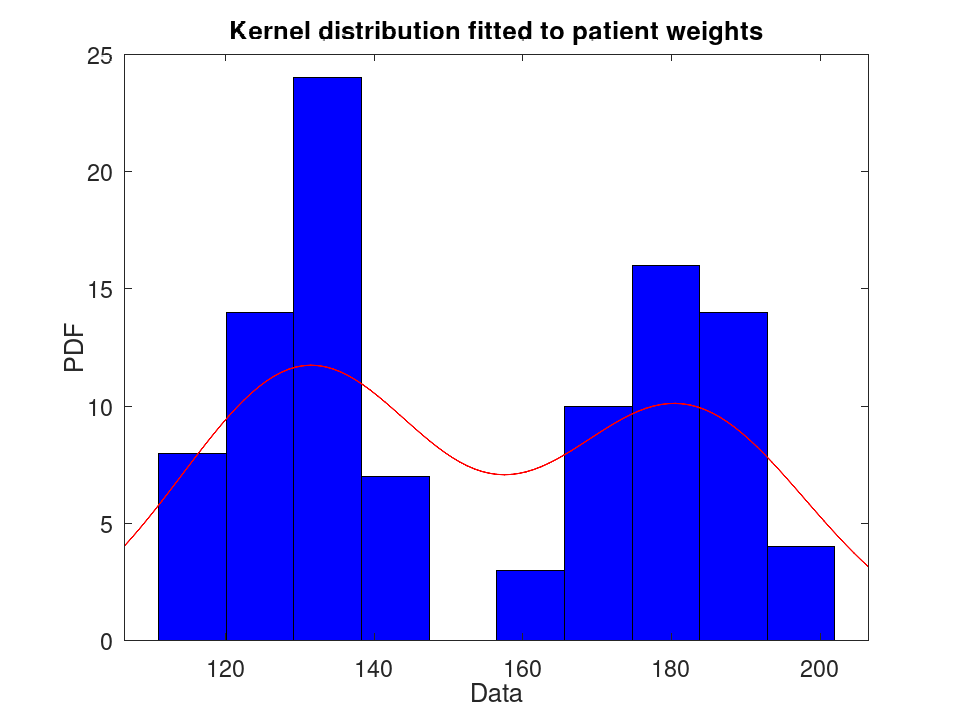
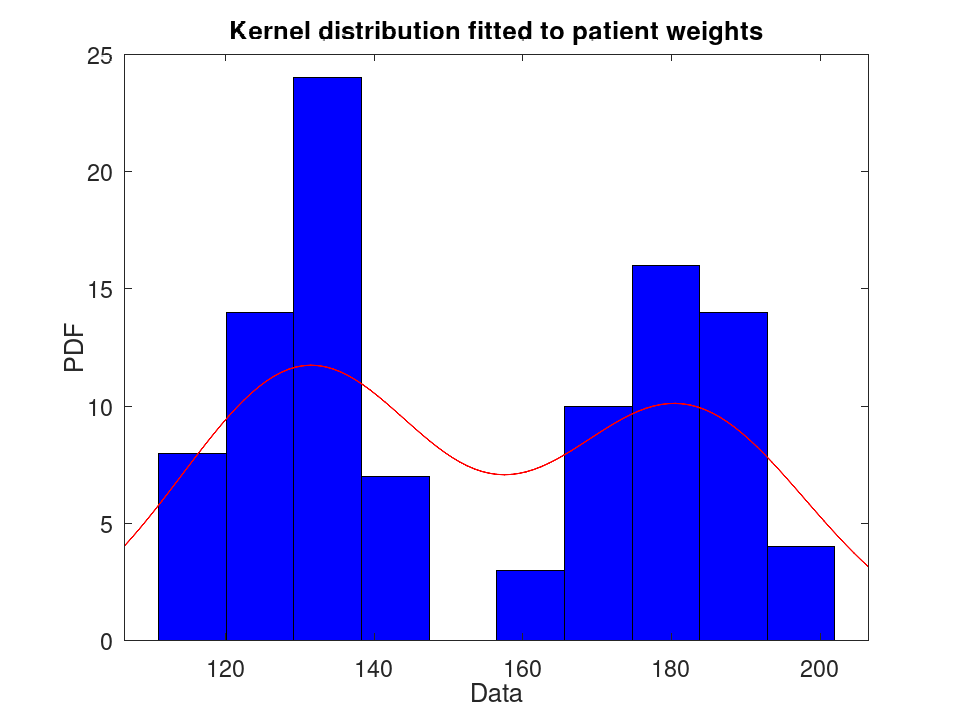
plot (pd) plots a probability density function (PDF) of the
probability distribution object pd, superimposed over a histogram
of the data used to fit it.
plot (pd, Name, Value) specifies additional
options with the Name-Value pair arguments listed below.
| Name | Value |
|---|---|
'PlotType' | A character vector specifying the plot
type. 'pdf' plots the probability density function (PDF)
superimposed on a histogram of the data. 'cdf' plots the
cumulative distribution function (CDF) superimposed over an empirical
CDF. 'probability' plots a probability plot using a CDF of the
data and a CDF of the fitted probability distribution. |
'Parent' | An axes graphics object for plot. If not
specified, the plot function plots into the current axes or
creates a new axes object if one does not exist. |
h = plot (…) returns a graphics handle to the plotted
objects.
Fit a kernel distribution to a sample and plot its PDF over a histogram.
 load patients
 pd = fitdist (Weight, 'Kernel');
 plot (pd)
 title ('Kernel distribution fitted to patient weights')
prob.KernelDistribution: r = random (pd)
prob.KernelDistribution: r = random (pd, rows)
prob.KernelDistribution: r = random (pd, rows, cols, …)
prob.KernelDistribution: r = random (pd, [sz])
r = random (pd) returns a random number from the
distribution object pd.
When called with a single size argument, random returns a square
matrix with the dimension specified. When called with more than one
scalar argument, the first two arguments are taken as the number of rows
and columns and any further arguments specify additional matrix
dimensions. The size may also be specified with a row vector of
dimensions, sz.
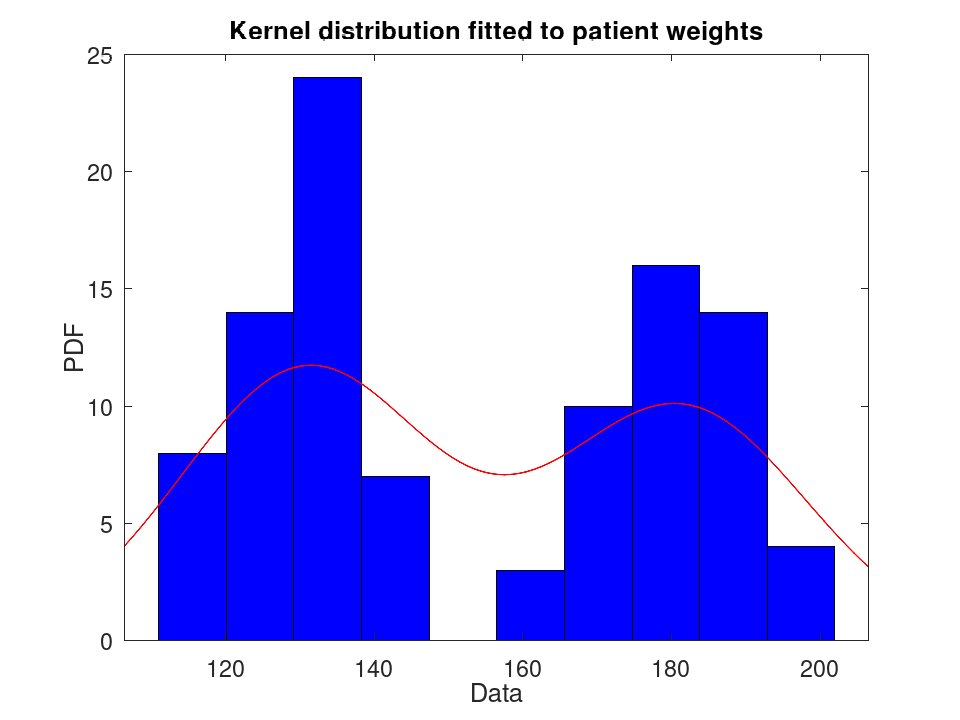
Fit a kernel distribution to a sample and plot its PDF over a histogram.
 load patients
 pd = fitdist (Weight, 'Kernel');
 plot (pd)
 title ('Kernel distribution fitted to patient weights')
prob.KernelDistribution: s = std (pd)
s = std (pd) computes the standard deviation of the
probability distribution object, pd.
Fit a kernel distribution to a sample and plot its PDF over a histogram.
 load patients
 pd = fitdist (Weight, 'Kernel');
 plot (pd)
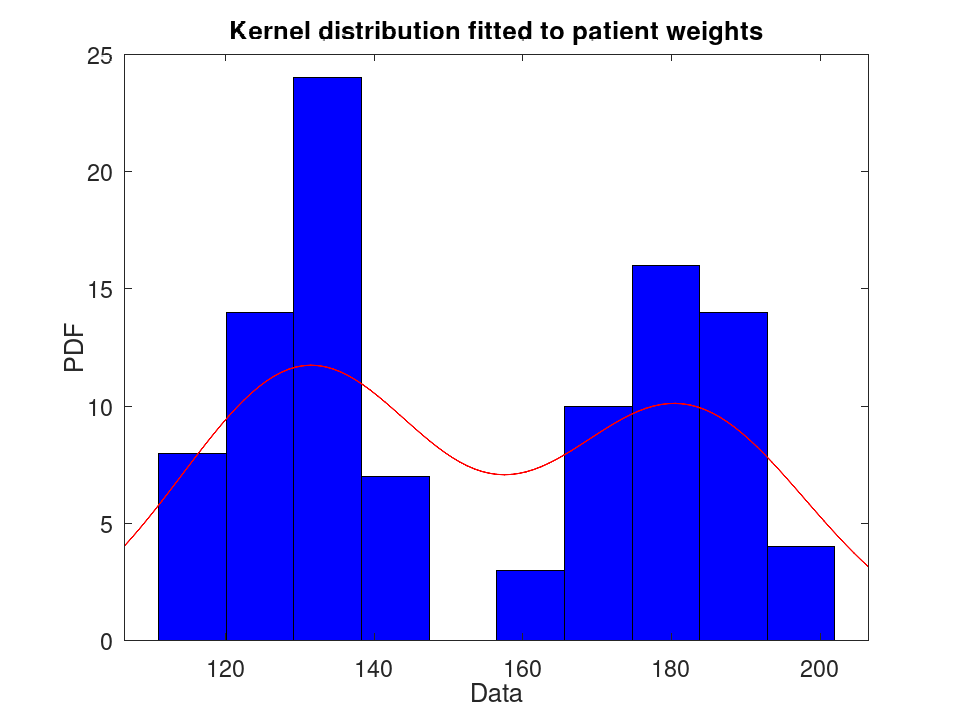
 title ('Kernel distribution fitted to patient weights')
prob.KernelDistribution: t = truncate (pd, lower, upper)
t = truncate (pd, lower, upper) returns a
probability distribution t, which is the probability distribution
pd truncated to the specified interval with lower limit,
lower, and upper limit, upper.
Fit a kernel distribution to a sample and plot its PDF over a histogram.
 load patients
 pd = fitdist (Weight, 'Kernel');
 plot (pd)
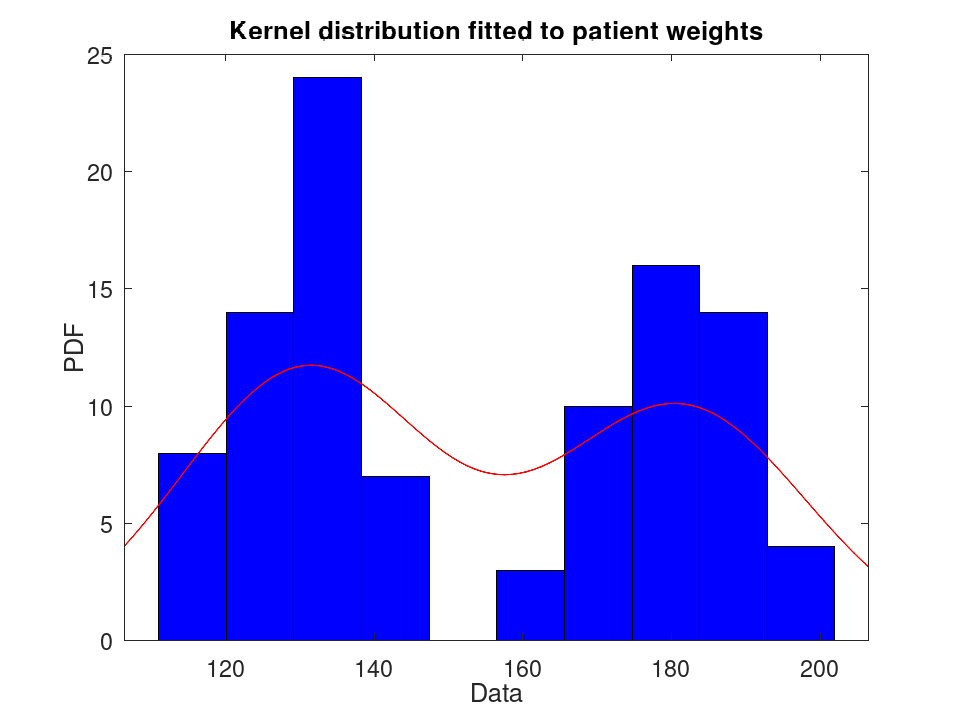
 title ('Kernel distribution fitted to patient weights')
prob.KernelDistribution: v = var (pd)
v = var (pd) computes the variance of the probability
distribution object, pd.
Fit a kernel distribution to a sample and plot its PDF over a histogram.
 load patients
 pd = fitdist (Weight, 'Kernel');
 plot (pd)
 title ('Kernel distribution fitted to patient weights')
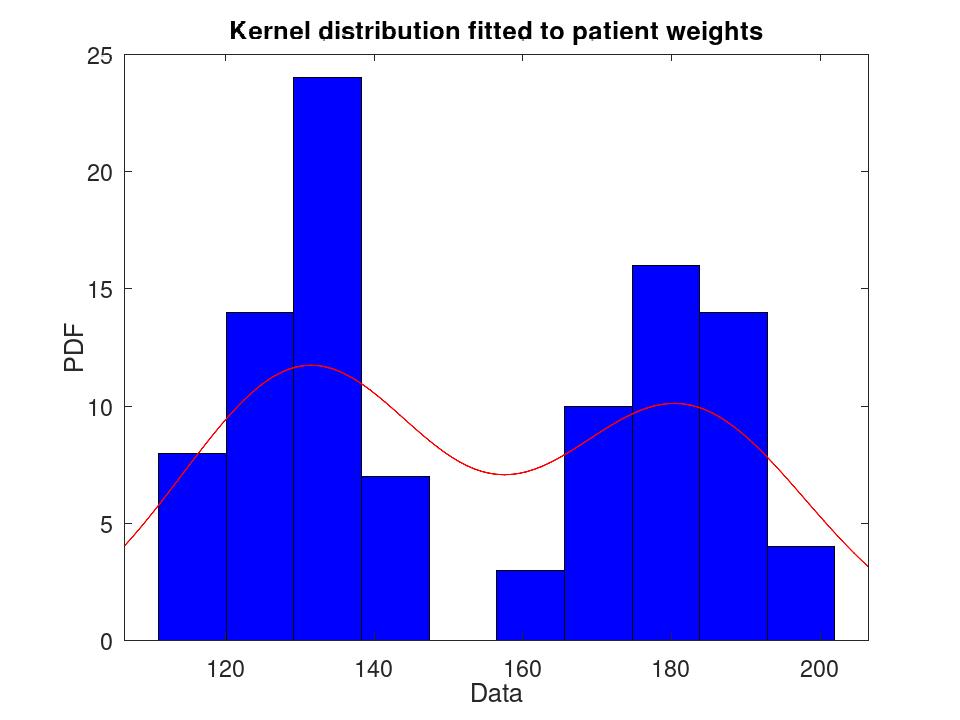
Examples
 load patients
 pd = fitdist (Weight, 'Kernel');
 plot (pd)
 title ('Kernel distribution fitted to patient weights')