Categories &
Functions List
- adtest
- anova
- anova1
- anova2
- anovan
- ansaribradley
- barttest
- binotest
- chi2gof
- chi2test
- correlation_test
- detectdrift
- dwtest
- fishertest
- friedman
- hotelling_t2test
- hotelling_t2test2
- jbtest
- knntest
- kruskalwallis
- kstest
- kstest2
- lillietest
- manova1
- mcnemar_test
- meanEffectSize
- mmdtest
- multcompare
- ranksum
- regression_ftest
- regression_ttest
- runstest
- signrank
- signtest
- stats.drift.DriftDiagnostics
- swtest
- ttest
- ttest2
- vartest
- vartest2
- vartestn
- ztest
- ztest2
- CompactLinearModel
- CoxModel
- coxphfit
- fitcox
- fitglm
- fitglme
- fitlm
- fitlme
- fitlmematrix
- fitnlm
- fitrm
- GeneralizedLinearMixedModel
- GeneralizedLinearModel
- glmfit
- glmval
- invpred
- lasso
- lassoglm
- LinearFormula
- LinearMixedModel
- LinearModel
- logistic_regression
- mnrfit
- mnrval
- monotone_smooth
- mvregress
- mvregresslike
- nlinfit
- nlparci
- nlpredci
- NonLinearModel
- plsregress
- regress
- regress_gp
- RepeatedMeasuresModel
- ridge
- robustfit
- stepwisefit
- stepwiseglm
- stepwiselm
- ClassificationBaggedEnsemble
- ClassificationDiscriminant
- ClassificationECOC
- ClassificationEnsemble
- ClassificationGAM
- ClassificationKernel
- ClassificationKNN
- ClassificationLinear
- ClassificationNaiveBayes
- ClassificationNeuralNetwork
- ClassificationPartitionedECOC
- ClassificationPartitionedEnsemble
- ClassificationPartitionedKernel
- ClassificationPartitionedLinear
- ClassificationPartitionedModel
- ClassificationSVM
- ClassificationTree
- CompactClassificationDiscriminant
- CompactClassificationECOC
- CompactClassificationEnsemble
- CompactClassificationGAM
- CompactClassificationNaiveBayes
- CompactClassificationNeuralNetwork
- CompactClassificationSVM
- CompactClassificationTree
- CompactRegressionGAM
- CompactRegressionEnsemble
- CompactRegressionGP
- CompactRegressionNeuralNetwork
- CompactRegressionSVM
- CompactRegressionTree
- CompactTreeBagger
- designecoc
- fcnnpredict
- fcnntrain
- fitcdiscr
- fitcecoc
- fitcensemble
- fitcgam
- fitckernel
- fitcknn
- fitclinear
- fitcnb
- fitcnet
- fitcsvm
- fitctree
- fitrensemble
- fitrgam
- fitrgp
- fitrkernel
- fitrlinear
- fitrnet
- fitrsvm
- fitrtree
- gamboostinter
- gamboostpairs
- gamboostpredict
- gamboosttrain
- gampredict
- gamtrain
- partialDependence
- plotPartialDependence
- PredictiveModel
- RegressionBaggedEnsemble
- RegressionEnsemble
- RegressionGAM
- RegressionGP
- RegressionKernel
- RegressionLinear
- RegressionNeuralNetwork
- RegressionPartitionedEnsemble
- RegressionPartitionedKernel
- RegressionPartitionedLinear
- RegressionPartitionedModel
- RegressionSVM
- RegressionTree
- lime
- shapley
- svmpredict
- svmtrain
- templateDiscriminant
- templateEnsemble
- templateKernel
- templateKNN
- templateLinear
- templateNaiveBayes
- templateSVM
- templateTree
- TreeBagger
- treepredict
- treetrain
- paretotails
- prob.ProbabilityDistribution
- prob.BetaDistribution
- prob.BinomialDistribution
- prob.BirnbaumSaundersDistribution
- prob.BurrDistribution
- prob.ExponentialDistribution
- prob.ExtremeValueDistribution
- prob.GammaDistribution
- prob.GeneralizedExtremeValueDistribution
- prob.GeneralizedParetoDistribution
- prob.HalfNormalDistribution
- prob.InverseGaussianDistribution
- prob.KernelDistribution
- prob.LogisticDistribution
- prob.LoglogisticDistribution
- prob.LognormalDistribution
- prob.LoguniformDistribution
- prob.MultinomialDistribution
- prob.NakagamiDistribution
- prob.NegativeBinomialDistribution
- prob.NormalDistribution
- prob.PiecewiseLinearDistribution
- prob.PoissonDistribution
- prob.RayleighDistribution
- prob.RicianDistribution
- prob.StableDistribution
- prob.tLocationScaleDistribution
- prob.TriangularDistribution
- prob.UniformDistribution
- prob.WeibullDistribution
- betafit
- betalike
- binofit
- binolike
- bisafit
- bisalike
- burrfit
- burrlike
- copulafit
- evfit
- evlike
- expfit
- explike
- gamfit
- gamlike
- geofit
- gevfit
- gevlike
- gevfit_lmom
- gpfit
- gplike
- gumbelfit
- gumbellike
- hnfit
- hnlike
- invgfit
- invglike
- logifit
- logilike
- loglfit
- logllike
- lognfit
- lognlike
- nakafit
- nakalike
- nbinfit
- nbinlike
- normfit
- normlike
- poissfit
- poisslike
- raylfit
- rayllike
- ricefit
- ricelike
- stblfit
- stbllike
- tlsfit
- tlslike
- unidfit
- unifit
- wblfit
- wbllike
- betacdf
- betainv
- betapdf
- betarnd
- binocdf
- binoinv
- binopdf
- binornd
- bisacdf
- bisainv
- bisapdf
- bisarnd
- burrcdf
- burrinv
- burrpdf
- burrrnd
- bvncdf
- bvtcdf
- cauchycdf
- cauchyinv
- cauchypdf
- cauchyrnd
- chi2cdf
- chi2inv
- chi2pdf
- chi2rnd
- copulacdf
- copulapdf
- copularnd
- evcdf
- evinv
- evpdf
- evrnd
- expcdf
- expinv
- exppdf
- exprnd
- fcdf
- finv
- fpdf
- frnd
- gamcdf
- gaminv
- gampdf
- gamrnd
- geocdf
- geoinv
- geopdf
- geornd
- gevcdf
- gevinv
- gevpdf
- gevrnd
- gpcdf
- gpinv
- gppdf
- gprnd
- gumbelcdf
- gumbelinv
- gumbelpdf
- gumbelrnd
- hncdf
- hninv
- hnpdf
- hnrnd
- hygecdf
- hygeinv
- hygepdf
- hygernd
- invgcdf
- invginv
- invgpdf
- invgrnd
- iwishpdf
- iwishrnd
- jsucdf
- jsupdf
- laplacecdf
- laplaceinv
- laplacepdf
- laplacernd
- logicdf
- logiinv
- logipdf
- logirnd
- loglcdf
- loglinv
- loglpdf
- loglrnd
- logncdf
- logninv
- lognpdf
- lognrnd
- mnpdf
- mnrnd
- mvncdf
- mvnpdf
- mvnrnd
- mvtcdf
- mvtpdf
- mvtrnd
- nakacdf
- nakainv
- nakapdf
- nakarnd
- nbincdf
- nbininv
- nbinpdf
- nbinrnd
- ncfcdf
- ncfinv
- ncfpdf
- ncfrnd
- nctcdf
- nctinv
- nctpdf
- nctrnd
- ncx2cdf
- ncx2inv
- ncx2pdf
- ncx2rnd
- normcdf
- norminv
- normpdf
- normrnd
- plcdf
- plinv
- plpdf
- plrnd
- poisscdf
- poissinv
- poisspdf
- poissrnd
- raylcdf
- raylinv
- raylpdf
- raylrnd
- ricecdf
- riceinv
- ricepdf
- ricernd
- stblcdf
- stblinv
- stblpdf
- stblrnd
- stdrcdf
- stdrinv
- stdrpdf
- stdrrnd
- tcdf
- tinv
- tpdf
- trnd
- tlscdf
- tlsinv
- tlspdf
- tlsrnd
- tricdf
- triinv
- tripdf
- trirnd
- unidcdf
- unidinv
- unidpdf
- unidrnd
- unifcdf
- unifinv
- unifpdf
- unifrnd
- vmcdf
- vminv
- vmpdf
- vmrnd
- wblcdf
- wblinv
- wblpdf
- wblrnd
- wienrnd
- wishpdf
- wishrnd
- betastat
- binostat
- bisastat
- burrstat
- chi2stat
- copulaparam
- copulastat
- evstat
- expstat
- fstat
- gamstat
- geostat
- gevstat
- gpstat
- gumbelstat
- hnstat
- hygestat
- invgstat
- logistat
- loglstat
- lognstat
- nakastat
- nbinstat
- ncfstat
- nctstat
- ncx2stat
- normstat
- plstat
- poisstat
- raylstat
- ricestat
- stdrstat
- tlsstat
- tristat
- tstat
- unidstat
- unifstat
- wblstat
- andrewsplot
- bar3
- bar3h
- biplot
- boxchart
- boxplot
- cdfplot
- dendrogram
- ecdfhist
- einstein
- gardnerAltmanPlot
- glyphplot
- gplotmatrix
- gscatter
- heatmap
- hist3
- histfit
- manovacluster
- normplot
- parallelcoords
- parallelplot
- ppplot
- probplot
- qqplot
- scatterhist
- scatterhistogram
- silhouette
- stats.chart.BoxChart
- stats.chart.HeatmapChart
- stats.chart.ParallelCoordinatesPlot
- stats.chart.ScatterHistogramChart
- swarmchart
- violin
- wblplot
Class Definition: rocmetrics
statistics: rocmetrics
Receiver operating characteristic (ROC) metrics for classifier output.
The rocmetrics class evaluates a classifier’s performance by
computing, for each class, a one-versus-all ROC curve together with a set
of threshold-dependent performance metrics. It stores the results in the
Metrics table and the per-class area under the curve in AUC,
and provides the addMetrics, average, and plot
methods for follow-up analysis.
For a problem with K classes and scores supplied as an
N-by-K matrix, the discriminant score used for class
k is the one-versus-all margin
Scores(:,k) - max (Scores(:,j)) over j != k, matching
MATLAB’s rocmetrics. Every metric is evaluated at each distinct
value of that margin.
See also: perfcurve, confusionmat, confusionchart
Source Code: rocmetrics
The rocmetrics class contains the following properties:
Table of performance metrics, vertically concatenated across the classes
in ClassNames order with one row per distinct threshold. The
standard variables are ClassName, Threshold,
FalsePositiveRate, and TruePositiveRate, followed by one
variable for each metric requested through 'AdditionalMetrics'.
This property is read-only.
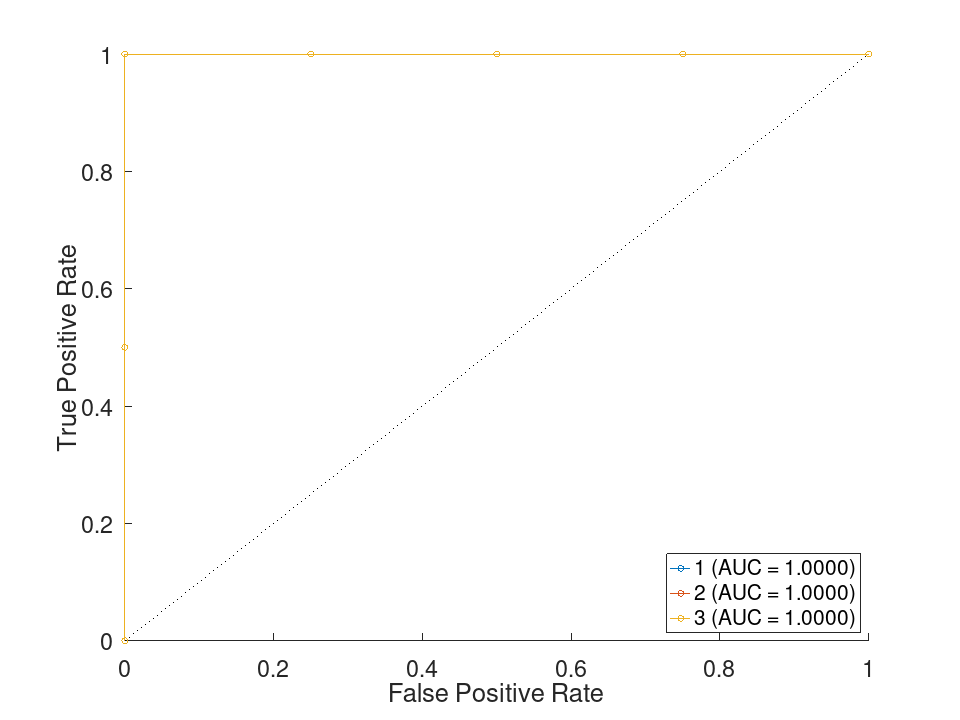
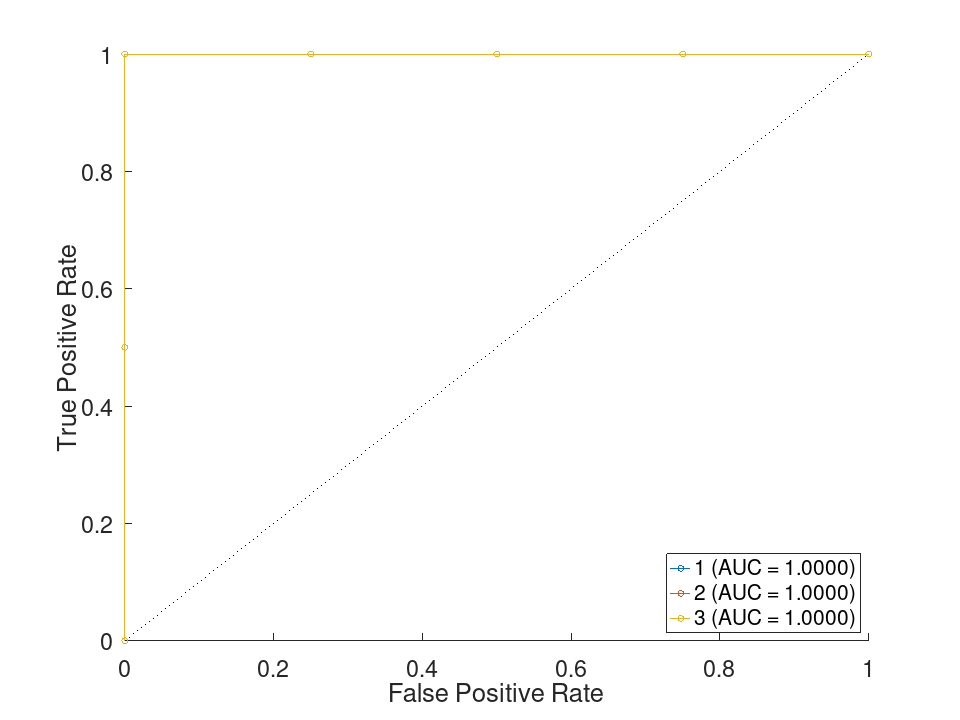
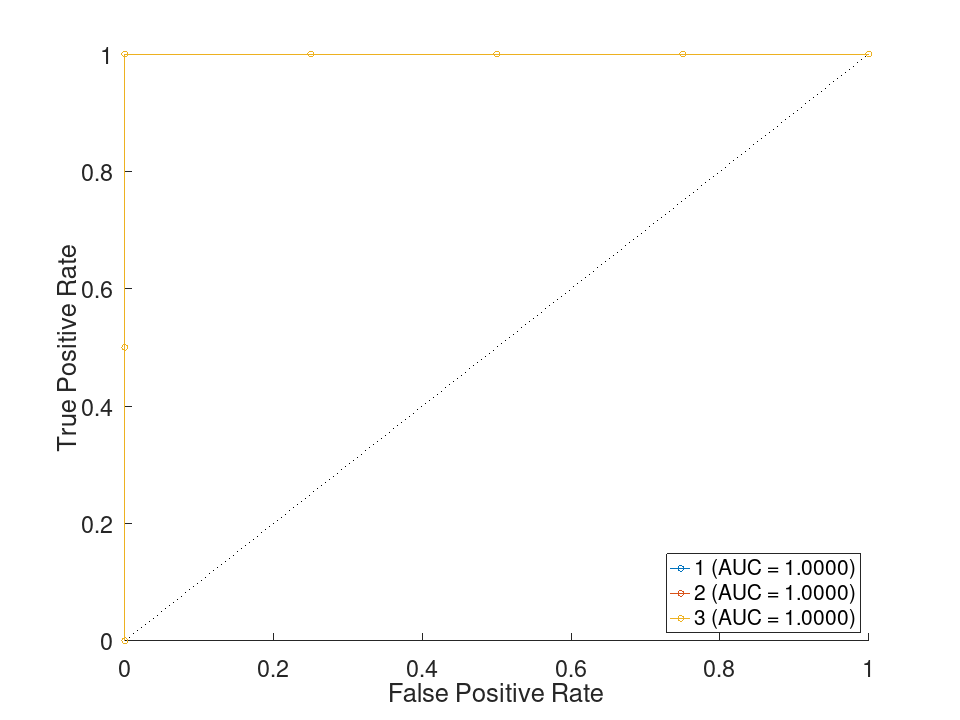
One-versus-all ROC curves for a three-class problem
 labels = [1 1 2 2 3 3]';
 scores = [0.9 0.05 0.05; 0.6 0.3 0.1; 0.2 0.7 0.1; ...
           0.1 0.6 0.3; 0.2 0.2 0.6; 0.1 0.3 0.6];
 rocObj = rocmetrics (labels, scores, [1 2 3]);
 disp (rocObj.AUC)
1 1 1
plot (rocObj);
Binary ROC metrics with additional performance metrics
 labels = [1 1 1 1 0 0]';
 p = [0.9 0.7 0.4 0.3 0.8 0.2]';
 scores = [1-p p];
 rocObj = rocmetrics (labels, scores, [0 1], ...
                      "AdditionalMetrics", {"Accuracy", "ExpectedCost"});
 head = rocObj.Metrics(1:4,:);
 disp (head);
  4x6 table

    ClassName    Threshold    FalsePositiveRate    TruePositiveRate    Accuracy    ExpectedCost
    _________    _________    _________________    ________________    ________    ____________

            0          0.6                    0                   0    0.666667       0.0740741
            0          0.6                    0                 0.5    0.833333        0.037037
            0          0.4                 0.25                 0.5    0.666667       0.0740741
            0          0.2                  0.5                 0.5         0.5        0.111111
Row vector holding the area under the one-versus-all ROC curve for each
class, in ClassNames order. This property is read-only.
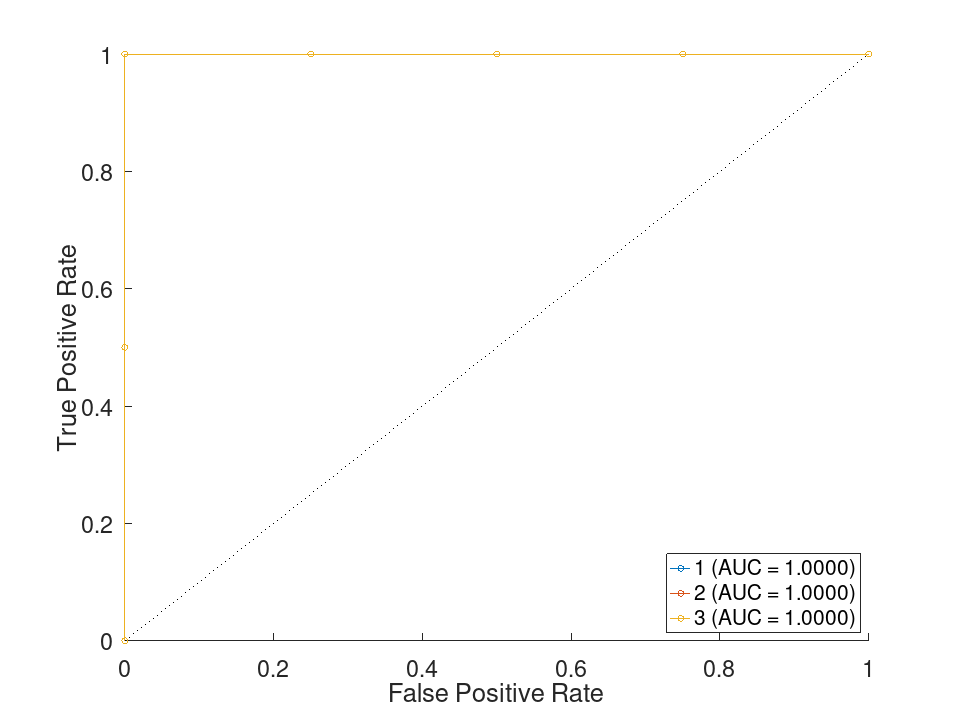
One-versus-all ROC curves for a three-class problem
 labels = [1 1 2 2 3 3]';
 scores = [0.9 0.05 0.05; 0.6 0.3 0.1; 0.2 0.7 0.1; ...
           0.1 0.6 0.3; 0.2 0.2 0.6; 0.1 0.3 0.6];
 rocObj = rocmetrics (labels, scores, [1 2 3]);
 disp (rocObj.AUC)
1 1 1
plot (rocObj);
Binary ROC metrics with additional performance metrics
 labels = [1 1 1 1 0 0]';
 p = [0.9 0.7 0.4 0.3 0.8 0.2]';
 scores = [1-p p];
 rocObj = rocmetrics (labels, scores, [0 1], ...
                      "AdditionalMetrics", {"Accuracy", "ExpectedCost"});
 head = rocObj.Metrics(1:4,:);
 disp (head);
  4x6 table

    ClassName    Threshold    FalsePositiveRate    TruePositiveRate    Accuracy    ExpectedCost
    _________    _________    _________________    ________________    ________    ____________

            0          0.6                    0                   0    0.666667       0.0740741
            0          0.6                    0                 0.5    0.833333        0.037037
            0          0.4                 0.25                 0.5    0.666667       0.0740741
            0          0.2                  0.5                 0.5         0.5        0.111111
Class names for which the ROC metrics are computed, in the column order
of Scores. This property is read-only.
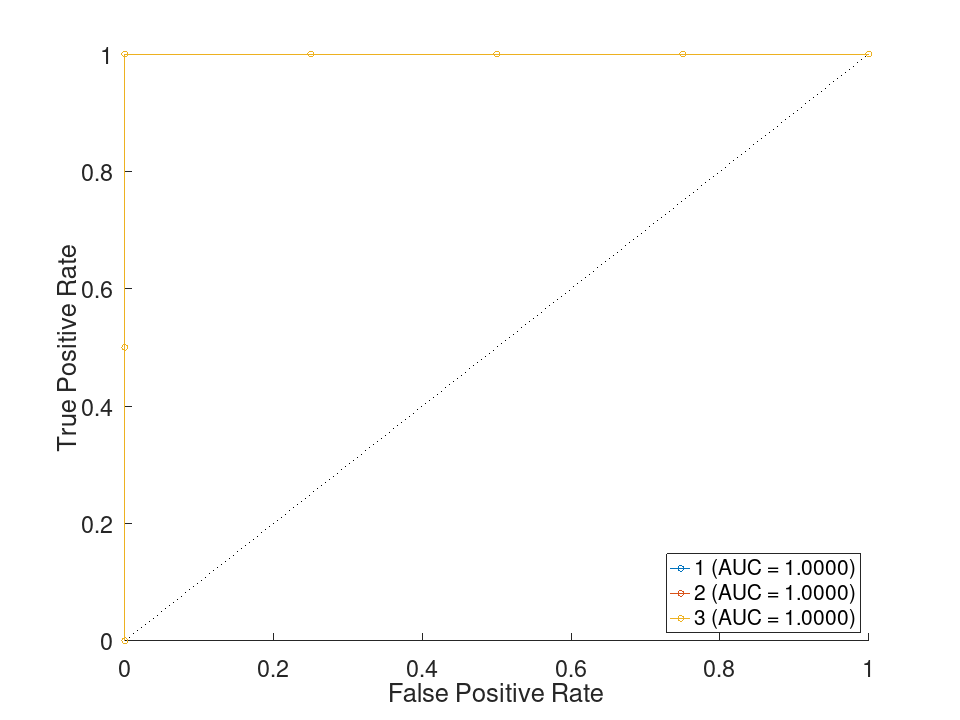
One-versus-all ROC curves for a three-class problem
 labels = [1 1 2 2 3 3]';
 scores = [0.9 0.05 0.05; 0.6 0.3 0.1; 0.2 0.7 0.1; ...
           0.1 0.6 0.3; 0.2 0.2 0.6; 0.1 0.3 0.6];
 rocObj = rocmetrics (labels, scores, [1 2 3]);
 disp (rocObj.AUC)
1 1 1
plot (rocObj);
Binary ROC metrics with additional performance metrics
 labels = [1 1 1 1 0 0]';
 p = [0.9 0.7 0.4 0.3 0.8 0.2]';
 scores = [1-p p];
 rocObj = rocmetrics (labels, scores, [0 1], ...
                      "AdditionalMetrics", {"Accuracy", "ExpectedCost"});
 head = rocObj.Metrics(1:4,:);
 disp (head);
  4x6 table

    ClassName    Threshold    FalsePositiveRate    TruePositiveRate    Accuracy    ExpectedCost
    _________    _________    _________________    ________________    ________    ____________

            0          0.6                    0                   0    0.666667       0.0740741
            0          0.6                    0                 0.5    0.833333        0.037037
            0          0.4                 0.25                 0.5    0.666667       0.0740741
            0          0.2                  0.5                 0.5         0.5        0.111111
Square misclassification-cost matrix, with zero diagonal and unit
off-diagonal entries by default. It is used by the ExpectedCost
metric. This property is read-only.
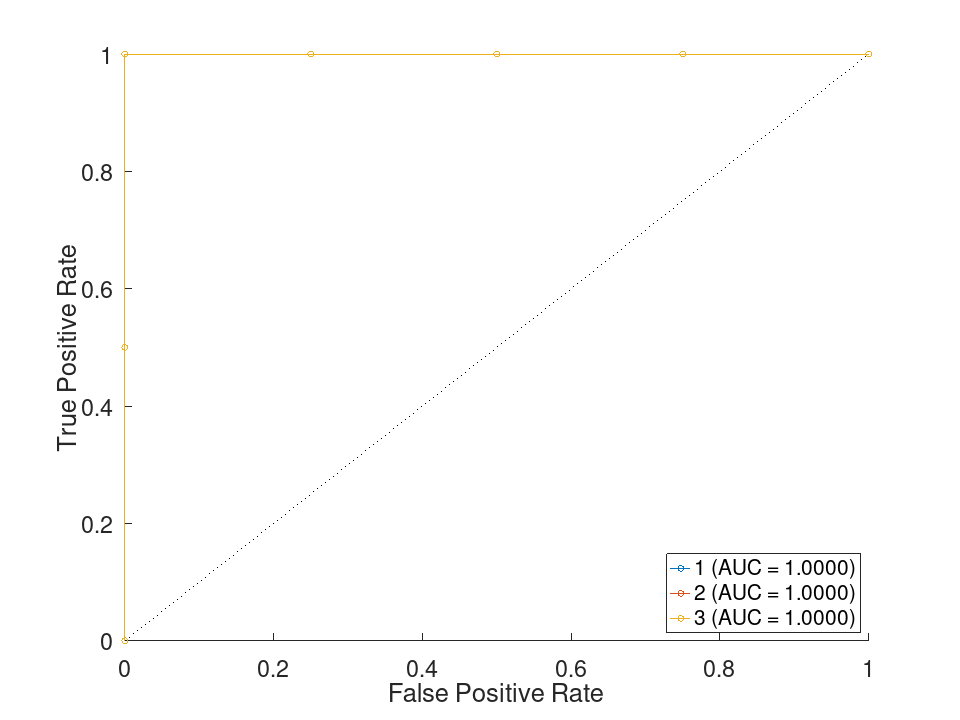
One-versus-all ROC curves for a three-class problem
 labels = [1 1 2 2 3 3]';
 scores = [0.9 0.05 0.05; 0.6 0.3 0.1; 0.2 0.7 0.1; ...
           0.1 0.6 0.3; 0.2 0.2 0.6; 0.1 0.3 0.6];
 rocObj = rocmetrics (labels, scores, [1 2 3]);
 disp (rocObj.AUC)
1 1 1
plot (rocObj);
Binary ROC metrics with additional performance metrics
 labels = [1 1 1 1 0 0]';
 p = [0.9 0.7 0.4 0.3 0.8 0.2]';
 scores = [1-p p];
 rocObj = rocmetrics (labels, scores, [0 1], ...
                      "AdditionalMetrics", {"Accuracy", "ExpectedCost"});
 head = rocObj.Metrics(1:4,:);
 disp (head);
  4x6 table

    ClassName    Threshold    FalsePositiveRate    TruePositiveRate    Accuracy    ExpectedCost
    _________    _________    _________________    ________________    ________    ____________

            0          0.6                    0                   0    0.666667       0.0740741
            0          0.6                    0                 0.5    0.833333        0.037037
            0          0.4                 0.25                 0.5    0.666667       0.0740741
            0          0.2                  0.5                 0.5         0.5        0.111111
Row vector of prior class probabilities, in ClassNames order,
summing to one. This property is read-only.
One-versus-all ROC curves for a three-class problem
 labels = [1 1 2 2 3 3]';
 scores = [0.9 0.05 0.05; 0.6 0.3 0.1; 0.2 0.7 0.1; ...
           0.1 0.6 0.3; 0.2 0.2 0.6; 0.1 0.3 0.6];
 rocObj = rocmetrics (labels, scores, [1 2 3]);
 disp (rocObj.AUC)
1 1 1
plot (rocObj);
Binary ROC metrics with additional performance metrics
 labels = [1 1 1 1 0 0]';
 p = [0.9 0.7 0.4 0.3 0.8 0.2]';
 scores = [1-p p];
 rocObj = rocmetrics (labels, scores, [0 1], ...
                      "AdditionalMetrics", {"Accuracy", "ExpectedCost"});
 head = rocObj.Metrics(1:4,:);
 disp (head);
  4x6 table

    ClassName    Threshold    FalsePositiveRate    TruePositiveRate    Accuracy    ExpectedCost
    _________    _________    _________________    ________________    ________    ____________

            0          0.6                    0                   0    0.666667       0.0740741
            0          0.6                    0                 0.5    0.833333        0.037037
            0          0.4                 0.25                 0.5    0.666667       0.0740741
            0          0.2                  0.5                 0.5         0.5        0.111111
True class labels supplied at construction, one per observation. This property is read-only.
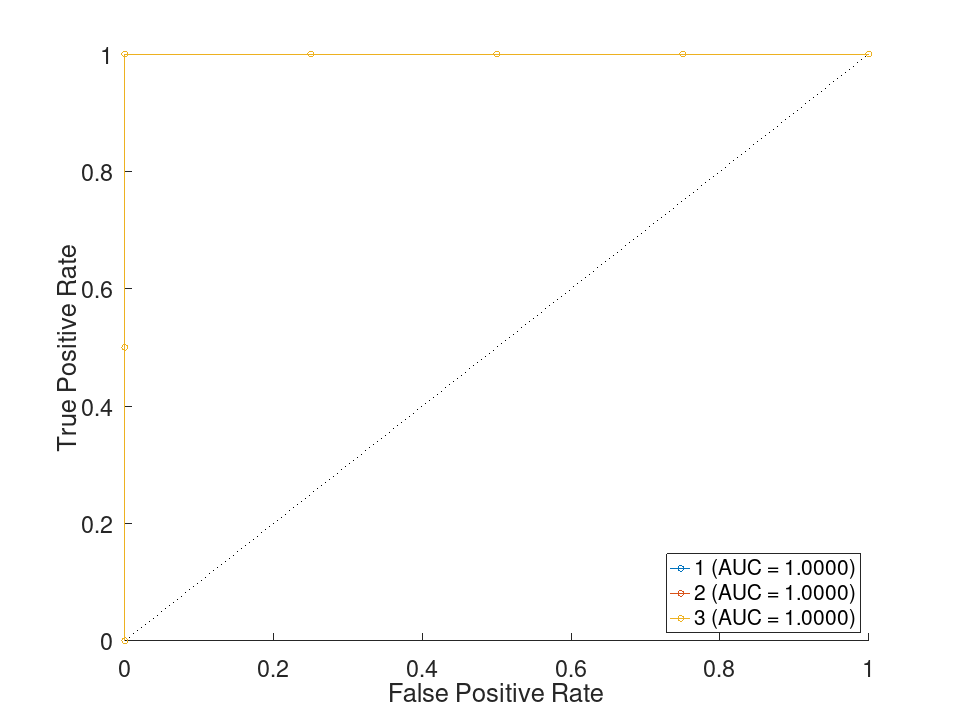
One-versus-all ROC curves for a three-class problem
 labels = [1 1 2 2 3 3]';
 scores = [0.9 0.05 0.05; 0.6 0.3 0.1; 0.2 0.7 0.1; ...
           0.1 0.6 0.3; 0.2 0.2 0.6; 0.1 0.3 0.6];
 rocObj = rocmetrics (labels, scores, [1 2 3]);
 disp (rocObj.AUC)
1 1 1
plot (rocObj);
Binary ROC metrics with additional performance metrics
 labels = [1 1 1 1 0 0]';
 p = [0.9 0.7 0.4 0.3 0.8 0.2]';
 scores = [1-p p];
 rocObj = rocmetrics (labels, scores, [0 1], ...
                      "AdditionalMetrics", {"Accuracy", "ExpectedCost"});
 head = rocObj.Metrics(1:4,:);
 disp (head);
  4x6 table

    ClassName    Threshold    FalsePositiveRate    TruePositiveRate    Accuracy    ExpectedCost
    _________    _________    _________________    ________________    ________    ____________

            0          0.6                    0                   0    0.666667       0.0740741
            0          0.6                    0                 0.5    0.833333        0.037037
            0          0.4                 0.25                 0.5    0.666667       0.0740741
            0          0.2                  0.5                 0.5         0.5        0.111111
Classification scores supplied at construction, as an N-by-K matrix. This property is read-only.
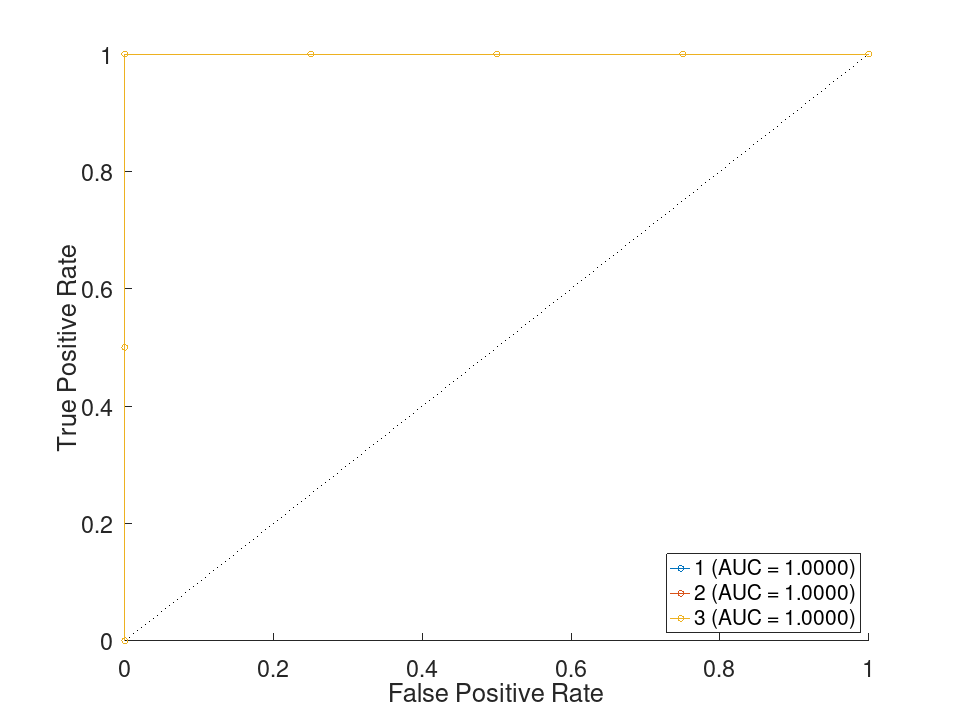
One-versus-all ROC curves for a three-class problem
 labels = [1 1 2 2 3 3]';
 scores = [0.9 0.05 0.05; 0.6 0.3 0.1; 0.2 0.7 0.1; ...
           0.1 0.6 0.3; 0.2 0.2 0.6; 0.1 0.3 0.6];
 rocObj = rocmetrics (labels, scores, [1 2 3]);
 disp (rocObj.AUC)
1 1 1
plot (rocObj);
Binary ROC metrics with additional performance metrics
 labels = [1 1 1 1 0 0]';
 p = [0.9 0.7 0.4 0.3 0.8 0.2]';
 scores = [1-p p];
 rocObj = rocmetrics (labels, scores, [0 1], ...
                      "AdditionalMetrics", {"Accuracy", "ExpectedCost"});
 head = rocObj.Metrics(1:4,:);
 disp (head);
  4x6 table

    ClassName    Threshold    FalsePositiveRate    TruePositiveRate    Accuracy    ExpectedCost
    _________    _________    _________________    ________________    ________    ____________

            0          0.6                    0                   0    0.666667       0.0740741
            0          0.6                    0                 0.5    0.833333        0.037037
            0          0.4                 0.25                 0.5    0.666667       0.0740741
            0          0.2                  0.5                 0.5         0.5        0.111111
Non-negative observation weights, one per observation. Defaults to a vector of ones. This property is read-only.
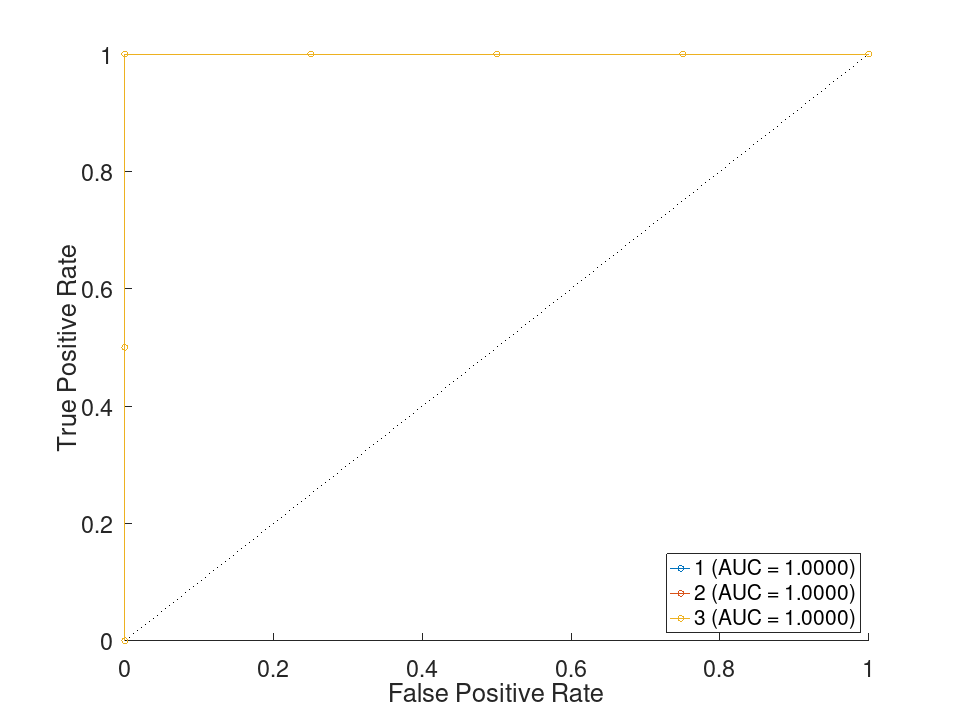
One-versus-all ROC curves for a three-class problem
 labels = [1 1 2 2 3 3]';
 scores = [0.9 0.05 0.05; 0.6 0.3 0.1; 0.2 0.7 0.1; ...
           0.1 0.6 0.3; 0.2 0.2 0.6; 0.1 0.3 0.6];
 rocObj = rocmetrics (labels, scores, [1 2 3]);
 disp (rocObj.AUC)
1 1 1
plot (rocObj);
Binary ROC metrics with additional performance metrics
 labels = [1 1 1 1 0 0]';
 p = [0.9 0.7 0.4 0.3 0.8 0.2]';
 scores = [1-p p];
 rocObj = rocmetrics (labels, scores, [0 1], ...
                      "AdditionalMetrics", {"Accuracy", "ExpectedCost"});
 head = rocObj.Metrics(1:4,:);
 disp (head);
  4x6 table

    ClassName    Threshold    FalsePositiveRate    TruePositiveRate    Accuracy    ExpectedCost
    _________    _________    _________________    ________________    ________    ____________

            0          0.6                    0                   0    0.666667       0.0740741
            0          0.6                    0                 0.5    0.833333        0.037037
            0          0.4                 0.25                 0.5    0.666667       0.0740741
            0          0.2                  0.5                 0.5         0.5        0.111111
The rocmetrics class offers the following public methods:
rocmetrics: obj = rocmetrics (labels, scores, classnames)
rocmetrics: obj = rocmetrics (…, Name, Value)
labels is a vector of true class labels with one element per
observation; it may be numeric, logical, a character matrix, or a cell
array of character vectors. scores is an N-by-K
numeric matrix of classification scores, where scores(i,k) is the
score of observation i for the class classnames(k).
classnames lists the K classes in the column order of
scores.
The following Name-Value pairs are supported:
| Name | Value |
|---|---|
'AdditionalMetrics' | A character vector or cell array
of metric names to append to Metrics. Supported names are
'TruePositives', 'FalseNegatives',
'FalsePositives', 'TrueNegatives',
'SumOfTrueAndFalsePositives',
'RateOfPositivePredictions',
'RateOfNegativePredictions', 'Accuracy',
'FalseNegativeRate', 'TrueNegativeRate',
'PositivePredictiveValue', 'NegativePredictiveValue',
'ExpectedCost', and 'f1score'. |
'Prior' | Prior class probabilities, given as
'empirical' (default), 'uniform', or a numeric vector
with one value per class. |
'Cost' | A K-by-K misclassification-cost
matrix used by the ExpectedCost metric. The default has zero
diagonal and unit off-diagonal entries. |
'Weights' | A vector of non-negative observation weights. The default is a vector of ones. |
'NaNFlag' | How to treat NaN scores:
'omitnan' (default) drops the affected observations, while
'includenan' treats them as always classified negative. |
'FixedMetricValues' | 'all' (default) to use
every distinct threshold, or a numeric vector of threshold values at
which to report the curve (nearest actual thresholds are returned). |
Construction from a trained model object, the 'FixedMetric'
grids other than thresholds, and bootstrap confidence intervals are not
implemented.
One-versus-all ROC curves for a three-class problem
 labels = [1 1 2 2 3 3]';
 scores = [0.9 0.05 0.05; 0.6 0.3 0.1; 0.2 0.7 0.1; ...
           0.1 0.6 0.3; 0.2 0.2 0.6; 0.1 0.3 0.6];
 rocObj = rocmetrics (labels, scores, [1 2 3]);
 disp (rocObj.AUC)
1 1 1
plot (rocObj);
Binary ROC metrics with additional performance metrics
 labels = [1 1 1 1 0 0]';
 p = [0.9 0.7 0.4 0.3 0.8 0.2]';
 scores = [1-p p];
 rocObj = rocmetrics (labels, scores, [0 1], ...
                      "AdditionalMetrics", {"Accuracy", "ExpectedCost"});
 head = rocObj.Metrics(1:4,:);
 disp (head);
  4x6 table

    ClassName    Threshold    FalsePositiveRate    TruePositiveRate    Accuracy    ExpectedCost
    _________    _________    _________________    ________________    ________    ____________

            0          0.6                    0                   0    0.666667       0.0740741
            0          0.6                    0                 0.5    0.833333        0.037037
            0          0.4                 0.25                 0.5    0.666667       0.0740741
            0          0.2                  0.5                 0.5         0.5        0.111111
rocmetrics: obj = addMetrics (obj, metrics)
metrics is a metric name or a cell array of metric names, chosen
from the list supported by the 'AdditionalMetrics' constructor
argument. The named metrics are appended as new variables of the
Metrics table; metrics already present are left unchanged.
One-versus-all ROC curves for a three-class problem
 labels = [1 1 2 2 3 3]';
 scores = [0.9 0.05 0.05; 0.6 0.3 0.1; 0.2 0.7 0.1; ...
           0.1 0.6 0.3; 0.2 0.2 0.6; 0.1 0.3 0.6];
 rocObj = rocmetrics (labels, scores, [1 2 3]);
 disp (rocObj.AUC)
1 1 1
plot (rocObj);
Binary ROC metrics with additional performance metrics
 labels = [1 1 1 1 0 0]';
 p = [0.9 0.7 0.4 0.3 0.8 0.2]';
 scores = [1-p p];
 rocObj = rocmetrics (labels, scores, [0 1], ...
                      "AdditionalMetrics", {"Accuracy", "ExpectedCost"});
 head = rocObj.Metrics(1:4,:);
 disp (head);
  4x6 table

    ClassName    Threshold    FalsePositiveRate    TruePositiveRate    Accuracy    ExpectedCost
    _________    _________    _________________    ________________    ________    ____________

            0          0.6                    0                   0    0.666667       0.0740741
            0          0.6                    0                 0.5    0.833333        0.037037
            0          0.4                 0.25                 0.5    0.666667       0.0740741
            0          0.2                  0.5                 0.5         0.5        0.111111
rocmetrics: [FPR, TPR, Thresholds, AUC] = average (obj, type)
type selects the averaging method: 'macro' (unweighted
mean of the per-class curves), 'micro' (a single curve pooling
every one-versus-all instance), or 'weighted' (mean of the
per-class curves weighted by Prior). The function returns the
averaged false and true positive rates FPR and TPR, the
corresponding Thresholds, and the area AUC under the
averaged curve.
The averaged curve is evaluated on the union of the per-class thresholds. MATLAB inserts additional staircase points when building the averaged curve, so the exact rows and the averaged AUC may differ slightly from MATLAB.
One-versus-all ROC curves for a three-class problem
 labels = [1 1 2 2 3 3]';
 scores = [0.9 0.05 0.05; 0.6 0.3 0.1; 0.2 0.7 0.1; ...
           0.1 0.6 0.3; 0.2 0.2 0.6; 0.1 0.3 0.6];
 rocObj = rocmetrics (labels, scores, [1 2 3]);
 disp (rocObj.AUC)
1 1 1
plot (rocObj);
Binary ROC metrics with additional performance metrics
 labels = [1 1 1 1 0 0]';
 p = [0.9 0.7 0.4 0.3 0.8 0.2]';
 scores = [1-p p];
 rocObj = rocmetrics (labels, scores, [0 1], ...
                      "AdditionalMetrics", {"Accuracy", "ExpectedCost"});
 head = rocObj.Metrics(1:4,:);
 disp (head);
  4x6 table

    ClassName    Threshold    FalsePositiveRate    TruePositiveRate    Accuracy    ExpectedCost
    _________    _________    _________________    ________________    ________    ____________

            0          0.6                    0                   0    0.666667       0.0740741
            0          0.6                    0                 0.5    0.833333        0.037037
            0          0.4                 0.25                 0.5    0.666667       0.0740741
            0          0.2                  0.5                 0.5         0.5        0.111111
rocmetrics: plot (obj)
rocmetrics: h = plot (obj)
Each class in ClassNames contributes one true-positive-rate
versus false-positive-rate curve. A handle to the line objects is
returned in h when requested.
One-versus-all ROC curves for a three-class problem
 labels = [1 1 2 2 3 3]';
 scores = [0.9 0.05 0.05; 0.6 0.3 0.1; 0.2 0.7 0.1; ...
           0.1 0.6 0.3; 0.2 0.2 0.6; 0.1 0.3 0.6];
 rocObj = rocmetrics (labels, scores, [1 2 3]);
 disp (rocObj.AUC)
1 1 1
plot (rocObj);
Binary ROC metrics with additional performance metrics
 labels = [1 1 1 1 0 0]';
 p = [0.9 0.7 0.4 0.3 0.8 0.2]';
 scores = [1-p p];
 rocObj = rocmetrics (labels, scores, [0 1], ...
                      "AdditionalMetrics", {"Accuracy", "ExpectedCost"});
 head = rocObj.Metrics(1:4,:);
 disp (head);
  4x6 table

    ClassName    Threshold    FalsePositiveRate    TruePositiveRate    Accuracy    ExpectedCost
    _________    _________    _________________    ________________    ________    ____________

            0          0.6                    0                   0    0.666667       0.0740741
            0          0.6                    0                 0.5    0.833333        0.037037
            0          0.4                 0.25                 0.5    0.666667       0.0740741
            0          0.2                  0.5                 0.5         0.5        0.111111
Examples
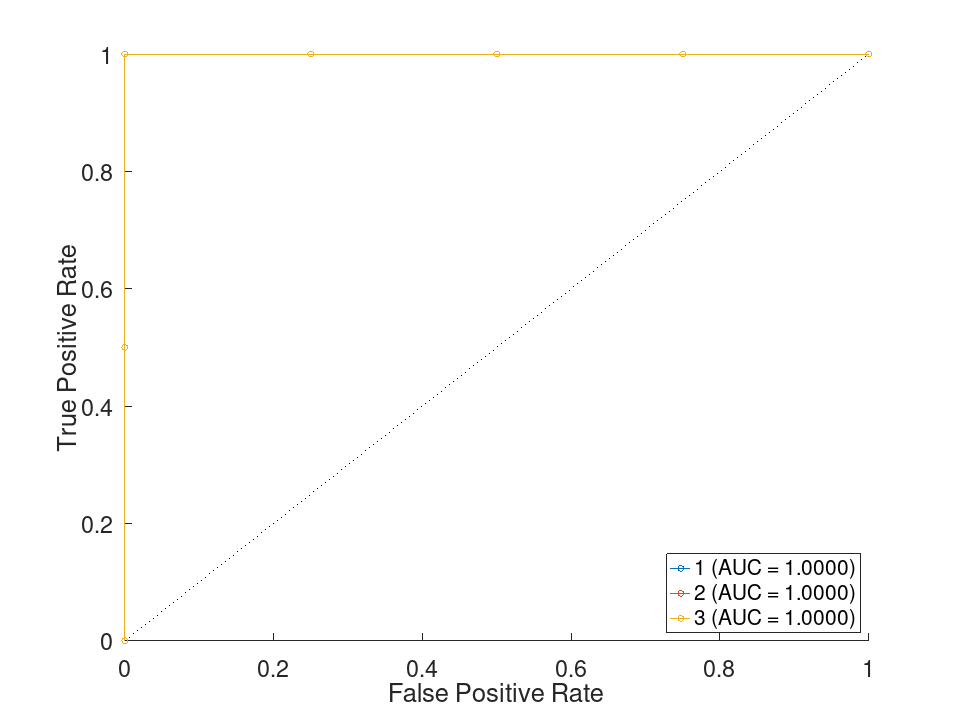
 labels = [1 1 2 2 3 3]';
 scores = [0.9 0.05 0.05; 0.6 0.3 0.1; 0.2 0.7 0.1; ...
           0.1 0.6 0.3; 0.2 0.2 0.6; 0.1 0.3 0.6];
 rocObj = rocmetrics (labels, scores, [1 2 3]);
 disp (rocObj.AUC)
1 1 1
plot (rocObj);
 labels = [1 1 1 1 0 0]';
 p = [0.9 0.7 0.4 0.3 0.8 0.2]';
 scores = [1-p p];
 rocObj = rocmetrics (labels, scores, [0 1], ...
                      "AdditionalMetrics", {"Accuracy", "ExpectedCost"});
 head = rocObj.Metrics(1:4,:);
 disp (head);
  4x6 table

    ClassName    Threshold    FalsePositiveRate    TruePositiveRate    Accuracy    ExpectedCost
    _________    _________    _________________    ________________    ________    ____________

            0          0.6                    0                   0    0.666667       0.0740741
            0          0.6                    0                 0.5    0.833333        0.037037
            0          0.4                 0.25                 0.5    0.666667       0.0740741
            0          0.2                  0.5                 0.5         0.5        0.111111