Categories &
Functions List
- adtest
- anova
- anova1
- anova2
- anovan
- ansaribradley
- barttest
- binotest
- chi2gof
- chi2test
- correlation_test
- detectdrift
- dwtest
- fishertest
- friedman
- hotelling_t2test
- hotelling_t2test2
- jbtest
- knntest
- kruskalwallis
- kstest
- kstest2
- lillietest
- manova1
- mcnemar_test
- meanEffectSize
- mmdtest
- multcompare
- ranksum
- regression_ftest
- regression_ttest
- runstest
- signrank
- signtest
- stats.drift.DriftDiagnostics
- swtest
- ttest
- ttest2
- vartest
- vartest2
- vartestn
- ztest
- ztest2
- CompactLinearModel
- CoxModel
- coxphfit
- fitcox
- fitglm
- fitglme
- fitlm
- fitlme
- fitlmematrix
- fitnlm
- fitrm
- GeneralizedLinearMixedModel
- GeneralizedLinearModel
- glmfit
- glmval
- invpred
- lasso
- lassoglm
- LinearFormula
- LinearMixedModel
- LinearModel
- logistic_regression
- mnrfit
- mnrval
- monotone_smooth
- mvregress
- mvregresslike
- nlinfit
- nlparci
- nlpredci
- NonLinearModel
- plsregress
- regress
- regress_gp
- RepeatedMeasuresModel
- ridge
- robustfit
- stepwisefit
- stepwiseglm
- stepwiselm
- ClassificationBaggedEnsemble
- ClassificationDiscriminant
- ClassificationECOC
- ClassificationEnsemble
- ClassificationGAM
- ClassificationKernel
- ClassificationKNN
- ClassificationLinear
- ClassificationNaiveBayes
- ClassificationNeuralNetwork
- ClassificationPartitionedECOC
- ClassificationPartitionedEnsemble
- ClassificationPartitionedKernel
- ClassificationPartitionedLinear
- ClassificationPartitionedModel
- ClassificationSVM
- ClassificationTree
- CompactClassificationDiscriminant
- CompactClassificationECOC
- CompactClassificationEnsemble
- CompactClassificationGAM
- CompactClassificationNaiveBayes
- CompactClassificationNeuralNetwork
- CompactClassificationSVM
- CompactClassificationTree
- CompactRegressionGAM
- CompactRegressionEnsemble
- CompactRegressionGP
- CompactRegressionNeuralNetwork
- CompactRegressionSVM
- CompactRegressionTree
- CompactTreeBagger
- designecoc
- fcnnpredict
- fcnntrain
- fitcdiscr
- fitcecoc
- fitcensemble
- fitcgam
- fitckernel
- fitcknn
- fitclinear
- fitcnb
- fitcnet
- fitcsvm
- fitctree
- fitrensemble
- fitrgam
- fitrgp
- fitrkernel
- fitrlinear
- fitrnet
- fitrsvm
- fitrtree
- gamboostinter
- gamboostpairs
- gamboostpredict
- gamboosttrain
- gampredict
- gamtrain
- partialDependence
- plotPartialDependence
- PredictiveModel
- RegressionBaggedEnsemble
- RegressionEnsemble
- RegressionGAM
- RegressionGP
- RegressionKernel
- RegressionLinear
- RegressionNeuralNetwork
- RegressionPartitionedEnsemble
- RegressionPartitionedKernel
- RegressionPartitionedLinear
- RegressionPartitionedModel
- RegressionSVM
- RegressionTree
- lime
- shapley
- svmpredict
- svmtrain
- templateDiscriminant
- templateEnsemble
- templateKernel
- templateKNN
- templateLinear
- templateNaiveBayes
- templateSVM
- templateTree
- TreeBagger
- treepredict
- treetrain
- paretotails
- prob.ProbabilityDistribution
- prob.BetaDistribution
- prob.BinomialDistribution
- prob.BirnbaumSaundersDistribution
- prob.BurrDistribution
- prob.ExponentialDistribution
- prob.ExtremeValueDistribution
- prob.GammaDistribution
- prob.GeneralizedExtremeValueDistribution
- prob.GeneralizedParetoDistribution
- prob.HalfNormalDistribution
- prob.InverseGaussianDistribution
- prob.KernelDistribution
- prob.LogisticDistribution
- prob.LoglogisticDistribution
- prob.LognormalDistribution
- prob.LoguniformDistribution
- prob.MultinomialDistribution
- prob.NakagamiDistribution
- prob.NegativeBinomialDistribution
- prob.NormalDistribution
- prob.PiecewiseLinearDistribution
- prob.PoissonDistribution
- prob.RayleighDistribution
- prob.RicianDistribution
- prob.StableDistribution
- prob.tLocationScaleDistribution
- prob.TriangularDistribution
- prob.UniformDistribution
- prob.WeibullDistribution
- betafit
- betalike
- binofit
- binolike
- bisafit
- bisalike
- burrfit
- burrlike
- copulafit
- evfit
- evlike
- expfit
- explike
- gamfit
- gamlike
- geofit
- gevfit
- gevlike
- gevfit_lmom
- gpfit
- gplike
- gumbelfit
- gumbellike
- hnfit
- hnlike
- invgfit
- invglike
- logifit
- logilike
- loglfit
- logllike
- lognfit
- lognlike
- nakafit
- nakalike
- nbinfit
- nbinlike
- normfit
- normlike
- poissfit
- poisslike
- raylfit
- rayllike
- ricefit
- ricelike
- stblfit
- stbllike
- tlsfit
- tlslike
- unidfit
- unifit
- wblfit
- wbllike
- betacdf
- betainv
- betapdf
- betarnd
- binocdf
- binoinv
- binopdf
- binornd
- bisacdf
- bisainv
- bisapdf
- bisarnd
- burrcdf
- burrinv
- burrpdf
- burrrnd
- bvncdf
- bvtcdf
- cauchycdf
- cauchyinv
- cauchypdf
- cauchyrnd
- chi2cdf
- chi2inv
- chi2pdf
- chi2rnd
- copulacdf
- copulapdf
- copularnd
- evcdf
- evinv
- evpdf
- evrnd
- expcdf
- expinv
- exppdf
- exprnd
- fcdf
- finv
- fpdf
- frnd
- gamcdf
- gaminv
- gampdf
- gamrnd
- geocdf
- geoinv
- geopdf
- geornd
- gevcdf
- gevinv
- gevpdf
- gevrnd
- gpcdf
- gpinv
- gppdf
- gprnd
- gumbelcdf
- gumbelinv
- gumbelpdf
- gumbelrnd
- hncdf
- hninv
- hnpdf
- hnrnd
- hygecdf
- hygeinv
- hygepdf
- hygernd
- invgcdf
- invginv
- invgpdf
- invgrnd
- iwishpdf
- iwishrnd
- jsucdf
- jsupdf
- laplacecdf
- laplaceinv
- laplacepdf
- laplacernd
- logicdf
- logiinv
- logipdf
- logirnd
- loglcdf
- loglinv
- loglpdf
- loglrnd
- logncdf
- logninv
- lognpdf
- lognrnd
- mnpdf
- mnrnd
- mvncdf
- mvnpdf
- mvnrnd
- mvtcdf
- mvtpdf
- mvtrnd
- nakacdf
- nakainv
- nakapdf
- nakarnd
- nbincdf
- nbininv
- nbinpdf
- nbinrnd
- ncfcdf
- ncfinv
- ncfpdf
- ncfrnd
- nctcdf
- nctinv
- nctpdf
- nctrnd
- ncx2cdf
- ncx2inv
- ncx2pdf
- ncx2rnd
- normcdf
- norminv
- normpdf
- normrnd
- plcdf
- plinv
- plpdf
- plrnd
- poisscdf
- poissinv
- poisspdf
- poissrnd
- raylcdf
- raylinv
- raylpdf
- raylrnd
- ricecdf
- riceinv
- ricepdf
- ricernd
- stblcdf
- stblinv
- stblpdf
- stblrnd
- stdrcdf
- stdrinv
- stdrpdf
- stdrrnd
- tcdf
- tinv
- tpdf
- trnd
- tlscdf
- tlsinv
- tlspdf
- tlsrnd
- tricdf
- triinv
- tripdf
- trirnd
- unidcdf
- unidinv
- unidpdf
- unidrnd
- unifcdf
- unifinv
- unifpdf
- unifrnd
- vmcdf
- vminv
- vmpdf
- vmrnd
- wblcdf
- wblinv
- wblpdf
- wblrnd
- wienrnd
- wishpdf
- wishrnd
- betastat
- binostat
- bisastat
- burrstat
- chi2stat
- copulaparam
- copulastat
- evstat
- expstat
- fstat
- gamstat
- geostat
- gevstat
- gpstat
- gumbelstat
- hnstat
- hygestat
- invgstat
- logistat
- loglstat
- lognstat
- nakastat
- nbinstat
- ncfstat
- nctstat
- ncx2stat
- normstat
- plstat
- poisstat
- raylstat
- ricestat
- stdrstat
- tlsstat
- tristat
- tstat
- unidstat
- unifstat
- wblstat
- andrewsplot
- bar3
- bar3h
- biplot
- boxchart
- boxplot
- cdfplot
- dendrogram
- ecdfhist
- einstein
- gardnerAltmanPlot
- glyphplot
- gplotmatrix
- gscatter
- heatmap
- hist3
- histfit
- manovacluster
- normplot
- parallelcoords
- parallelplot
- ppplot
- probplot
- qqplot
- scatterhist
- scatterhistogram
- silhouette
- stats.chart.BoxChart
- stats.chart.HeatmapChart
- stats.chart.ParallelCoordinatesPlot
- stats.chart.ScatterHistogramChart
- swarmchart
- violin
- wblplot
Class Definition: prob.LoguniformDistribution
statistics: prob.LoguniformDistribution
Log-uniform probability distribution object.
A prob.LoguniformDistribution object consists of parameters and a
model description for a log-uniform probability distribution.
The log-uniform distribution is a continuous probability distribution that is constant between locations Lower and Upper on a logarithmic scale.
There are several ways to create a prob.LoguniformDistribution
object.
- Create a distribution with specified parameter values using the
makedistfunction. - Use the constructor
prob.LoguniformDistribution (Lower,
 Upper)
to create a log-uniform distribution with specified parameter values Lower and Upper.
It is highly recommended to use makedist function to create
probability distribution objects, instead of the class constructor.
Further information about the log-uniform distribution can be found at https://en.wikipedia.org/wiki/Reciprocal_distribution
See also: makedist
Source Code: prob.LoguniformDistribution
The prob.LoguniformDistribution class contains the following properties:
A positive scalar value characterizing the lower limit of the
log-uniform distribution. You can access the Lower
property using dot name assignment.
Create a Log-uniform distribution with default parameters
pd = LoguniformDistribution ();
error: 'LoguniformDistribution' undefined near line 1, column 7

The 'LoguniformDistribution' function belongs to the 'statistics' package
indexed in Octave Packages at <https://packages.octave.org> but has not yet been
implemented.
Query parameter 'Lower' (lower limit)
pd.Lower
Set parameter 'Lower'
pd.Lower = 0.5
Use this to initialize or modify the lower limit of a Log-uniform distribution. The lower limit must be a positive real scalar, defining the minimum value in the support range, useful for modeling quantities spanning orders of magnitude, like particle sizes or frequencies.
Create a Log-uniform distribution object by calling its constructor
pd = LoguniformDistribution (0.1, 10)
error: 'LoguniformDistribution' undefined near line 1, column 7

The 'LoguniformDistribution' function belongs to the 'statistics' package
indexed in Octave Packages at <https://packages.octave.org> but has not yet been
implemented.
Query parameter 'Lower'
pd.Lower
This demonstrates direct construction with a specific lower limit, suitable for scenarios where the distribution starts from a small positive value, such as in Bayesian priors for scale parameters.
A positive scalar value characterizing the upper limit of the
log-uniform distribution. You can access the Upper
property using dot name assignment.
Create a Log-uniform distribution with default parameters
pd = LoguniformDistribution ();
error: 'LoguniformDistribution' undefined near line 1, column 7

The 'LoguniformDistribution' function belongs to the 'statistics' package
indexed in Octave Packages at <https://packages.octave.org> but has not yet been
implemented.
Query parameter 'Upper' (upper limit)
pd.Upper
Set parameter 'Upper'
pd.Upper = 5
Use this to initialize or modify the upper limit of a Log-uniform distribution. The upper limit must be a positive real scalar greater than Lower, defining the maximum value in the support range.
Create a Log-uniform distribution object by calling its constructor
pd = LoguniformDistribution (1, 100)
error: 'LoguniformDistribution' undefined near line 1, column 7

The 'LoguniformDistribution' function belongs to the 'statistics' package
indexed in Octave Packages at <https://packages.octave.org> but has not yet been
implemented.
Query parameter 'Upper'
pd.Upper
This shows how to set the upper limit directly via the constructor, ideal for bounding the distribution in applications like parameter estimation over wide ranges.
Create a Log-uniform distribution with default parameters (Lower=1, Upper=4)
pd = LoguniformDistribution ()
error: 'LoguniformDistribution' undefined near line 1, column 7

The 'LoguniformDistribution' function belongs to the 'statistics' package
indexed in Octave Packages at <https://packages.octave.org> but has not yet been
implemented.
This is the basic constructor call, useful for quick initialization with standard bounds for exploratory analysis.
Create a Log-uniform distribution with specified parameters
pd = LoguniformDistribution (0.01, 100)
error: 'LoguniformDistribution' undefined near line 1, column 7

The 'LoguniformDistribution' function belongs to the 'statistics' package
indexed in Octave Packages at <https://packages.octave.org> but has not yet been
implemented.
Use this constructor to define custom bounds, appropriate for modeling variables with logarithmic uniformity, such as in astrophysics or economics for quantities like incomes or sizes.
A character vector specifying the name of the probability distribution object. This property is read-only.
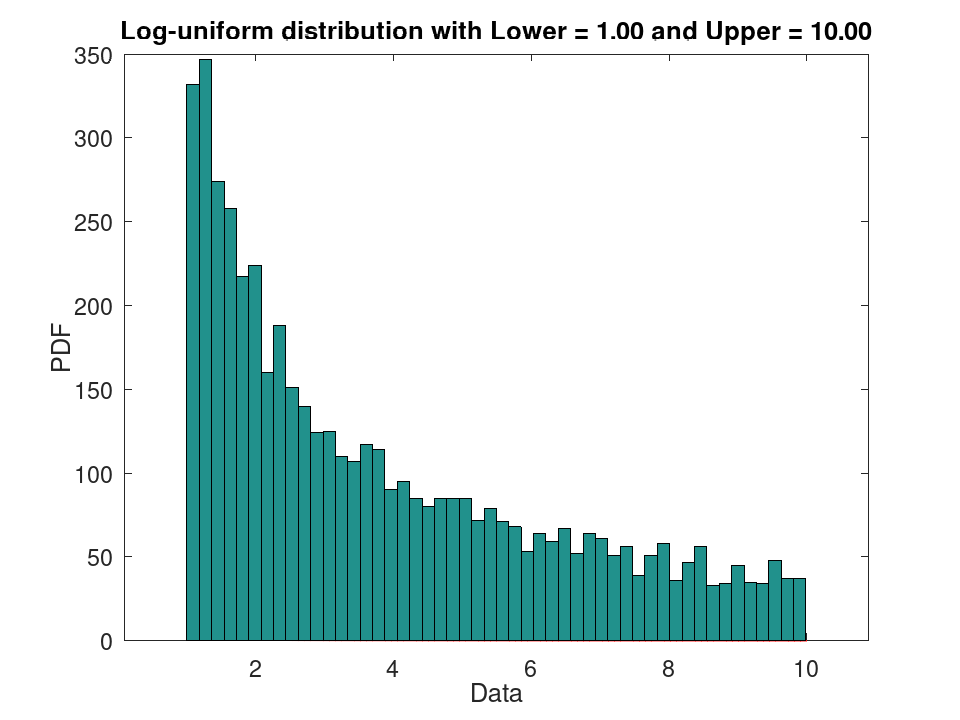
Generate a data set of 5000 random samples from a Log-uniform distribution with parameters Lower = 1 and Upper = 10. Plot a PDF of the distribution superimposed on a histogram of the data.
 rng (42);
 randg ('state', 42);
 rande ('state', 42);
 randp ('state', 42);
 pd_fixed = makedist ('Loguniform', 'Lower', 1, 'Upper', 10);
 data = random (pd_fixed, 5000, 1);
 plot (pd_fixed)
 hold on
 hist (data, 50)
 hold off
 msg = 'Log-uniform distribution with Lower = %0.2f and Upper = %0.2f';
 title (sprintf (msg, pd_fixed.Lower, pd_fixed.Upper))
A scalar integer value specifying the number of parameters characterizing the probability distribution. This property is read-only.
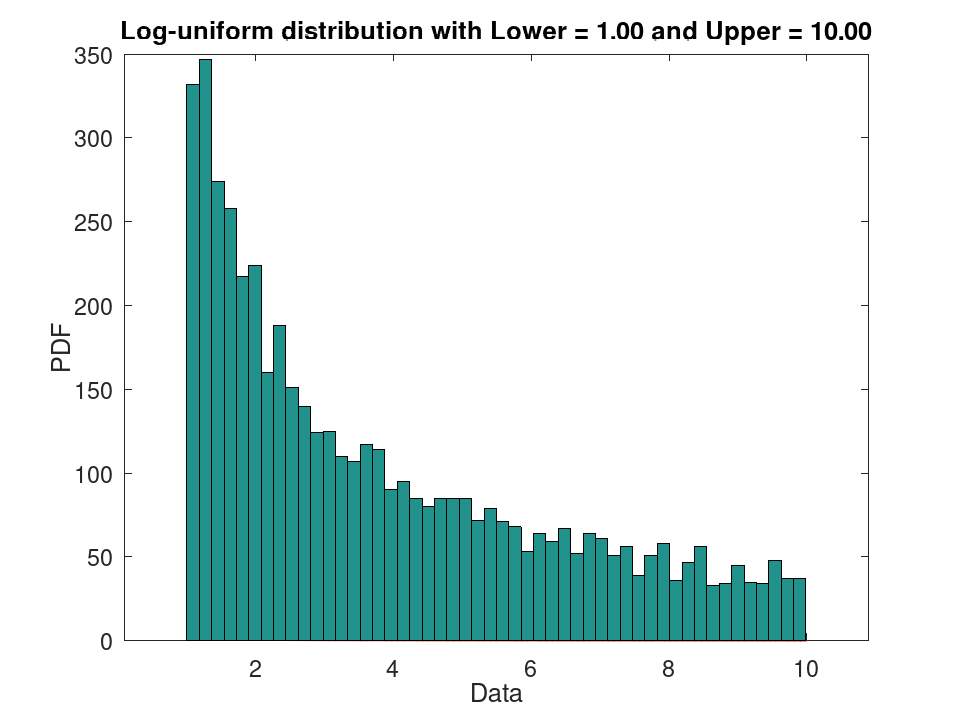
Generate a data set of 5000 random samples from a Log-uniform distribution with parameters Lower = 1 and Upper = 10. Plot a PDF of the distribution superimposed on a histogram of the data.
 rng (42);
 randg ('state', 42);
 rande ('state', 42);
 randp ('state', 42);
 pd_fixed = makedist ('Loguniform', 'Lower', 1, 'Upper', 10);
 data = random (pd_fixed, 5000, 1);
 plot (pd_fixed)
 hold on
 hist (data, 50)
 hold off
 msg = 'Log-uniform distribution with Lower = %0.2f and Upper = %0.2f';
 title (sprintf (msg, pd_fixed.Lower, pd_fixed.Upper))
A 2×1 cell array of character vectors with each element containing the name of a distribution parameter. This property is read-only.
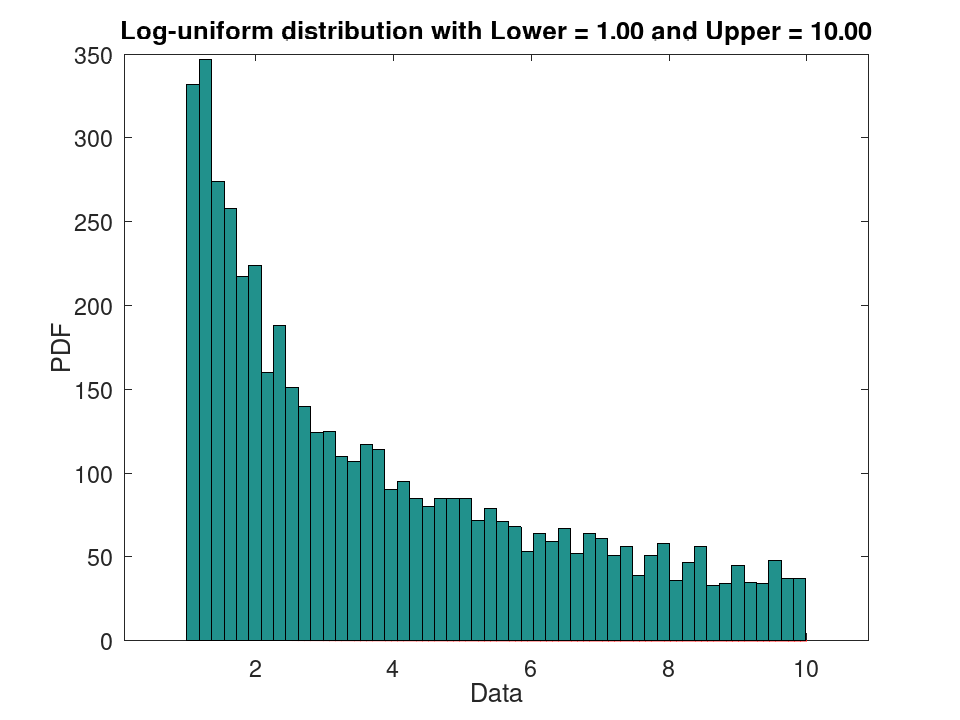
Generate a data set of 5000 random samples from a Log-uniform distribution with parameters Lower = 1 and Upper = 10. Plot a PDF of the distribution superimposed on a histogram of the data.
 rng (42);
 randg ('state', 42);
 rande ('state', 42);
 randp ('state', 42);
 pd_fixed = makedist ('Loguniform', 'Lower', 1, 'Upper', 10);
 data = random (pd_fixed, 5000, 1);
 plot (pd_fixed)
 hold on
 hist (data, 50)
 hold off
 msg = 'Log-uniform distribution with Lower = %0.2f and Upper = %0.2f';
 title (sprintf (msg, pd_fixed.Lower, pd_fixed.Upper))
A 2×1 cell array of character vectors with each element containing a short description of a distribution parameter. This property is read-only.
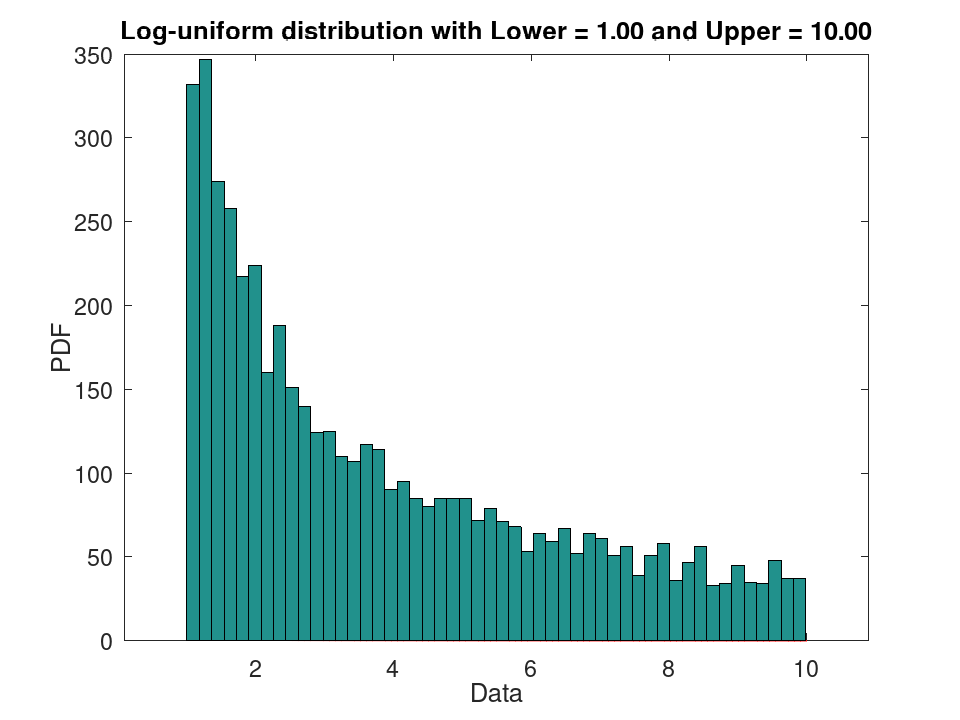
Generate a data set of 5000 random samples from a Log-uniform distribution with parameters Lower = 1 and Upper = 10. Plot a PDF of the distribution superimposed on a histogram of the data.
 rng (42);
 randg ('state', 42);
 rande ('state', 42);
 randp ('state', 42);
 pd_fixed = makedist ('Loguniform', 'Lower', 1, 'Upper', 10);
 data = random (pd_fixed, 5000, 1);
 plot (pd_fixed)
 hold on
 hist (data, 50)
 hold off
 msg = 'Log-uniform distribution with Lower = %0.2f and Upper = %0.2f';
 title (sprintf (msg, pd_fixed.Lower, pd_fixed.Upper))
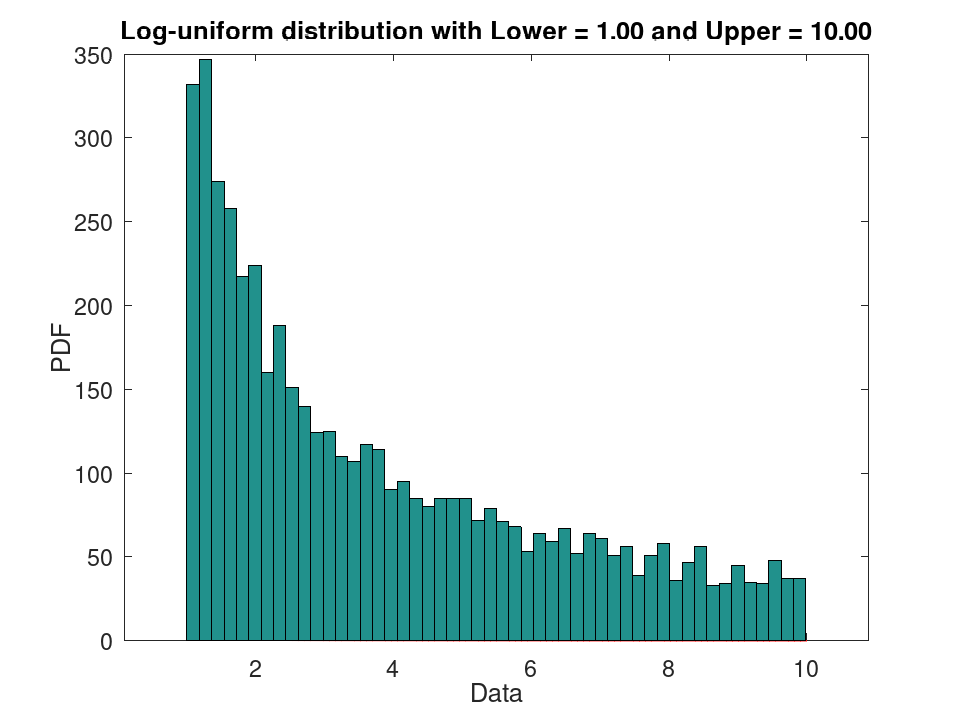
A 2×1 numeric vector containing the values of the distribution
parameters. This property is read-only. You can change the distribution
parameters by assigning new values to the Lower and Upper
properties.
Generate a data set of 5000 random samples from a Log-uniform distribution with parameters Lower = 1 and Upper = 10. Plot a PDF of the distribution superimposed on a histogram of the data.
 rng (42);
 randg ('state', 42);
 rande ('state', 42);
 randp ('state', 42);
 pd_fixed = makedist ('Loguniform', 'Lower', 1, 'Upper', 10);
 data = random (pd_fixed, 5000, 1);
 plot (pd_fixed)
 hold on
 hist (data, 50)
 hold off
 msg = 'Log-uniform distribution with Lower = %0.2f and Upper = %0.2f';
 title (sprintf (msg, pd_fixed.Lower, pd_fixed.Upper))
A 1×2 numeric vector specifying the truncation interval for the
probability distribution. First element contains the lower boundary,
second element contains the upper boundary. This property is read-only.
You can only truncate a probability distribution with the
truncate method.
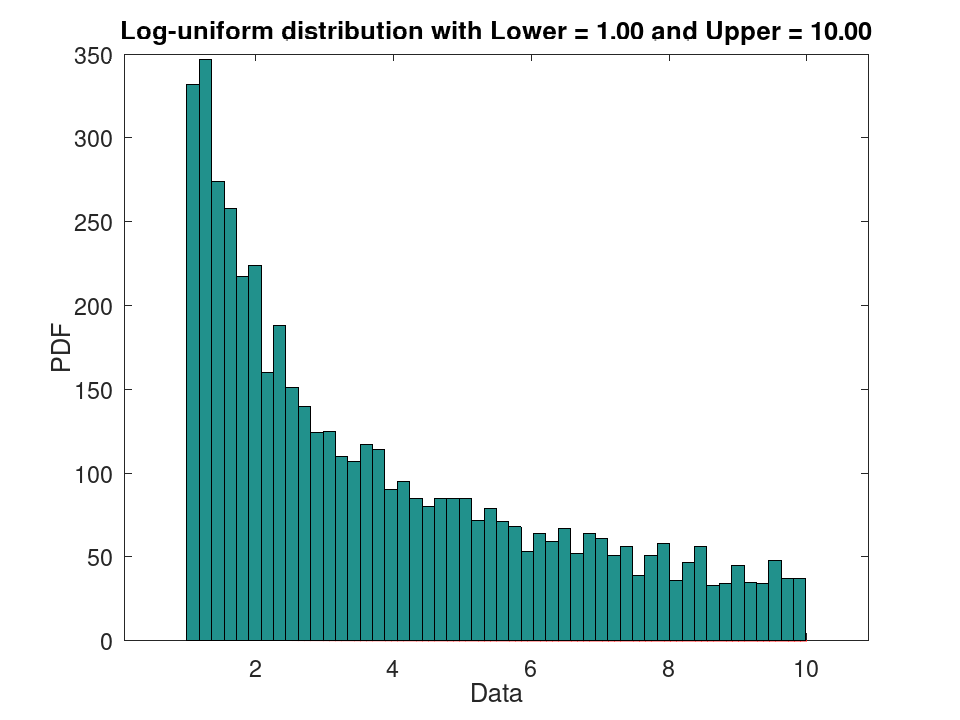
Generate a data set of 5000 random samples from a Log-uniform distribution with parameters Lower = 1 and Upper = 10. Plot a PDF of the distribution superimposed on a histogram of the data.
 rng (42);
 randg ('state', 42);
 rande ('state', 42);
 randp ('state', 42);
 pd_fixed = makedist ('Loguniform', 'Lower', 1, 'Upper', 10);
 data = random (pd_fixed, 5000, 1);
 plot (pd_fixed)
 hold on
 hist (data, 50)
 hold off
 msg = 'Log-uniform distribution with Lower = %0.2f and Upper = %0.2f';
 title (sprintf (msg, pd_fixed.Lower, pd_fixed.Upper))
A logical scalar value specifying whether a probability distribution is truncated or not. This property is read-only.
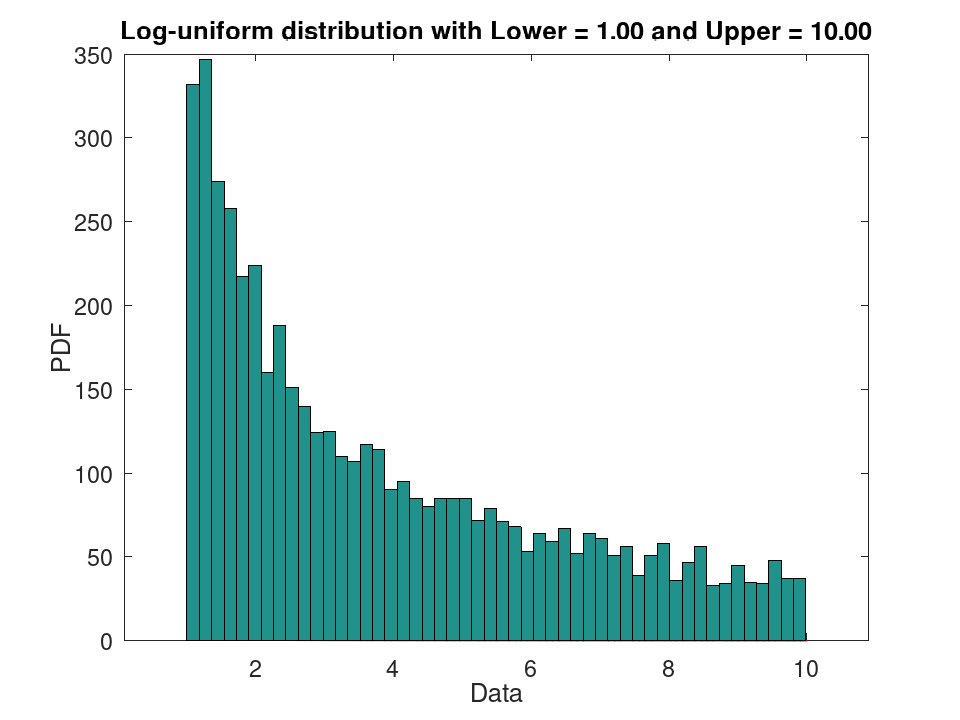
Generate a data set of 5000 random samples from a Log-uniform distribution with parameters Lower = 1 and Upper = 10. Plot a PDF of the distribution superimposed on a histogram of the data.
 rng (42);
 randg ('state', 42);
 rande ('state', 42);
 randp ('state', 42);
 pd_fixed = makedist ('Loguniform', 'Lower', 1, 'Upper', 10);
 data = random (pd_fixed, 5000, 1);
 plot (pd_fixed)
 hold on
 hist (data, 50)
 hold off
 msg = 'Log-uniform distribution with Lower = %0.2f and Upper = %0.2f';
 title (sprintf (msg, pd_fixed.Lower, pd_fixed.Upper))
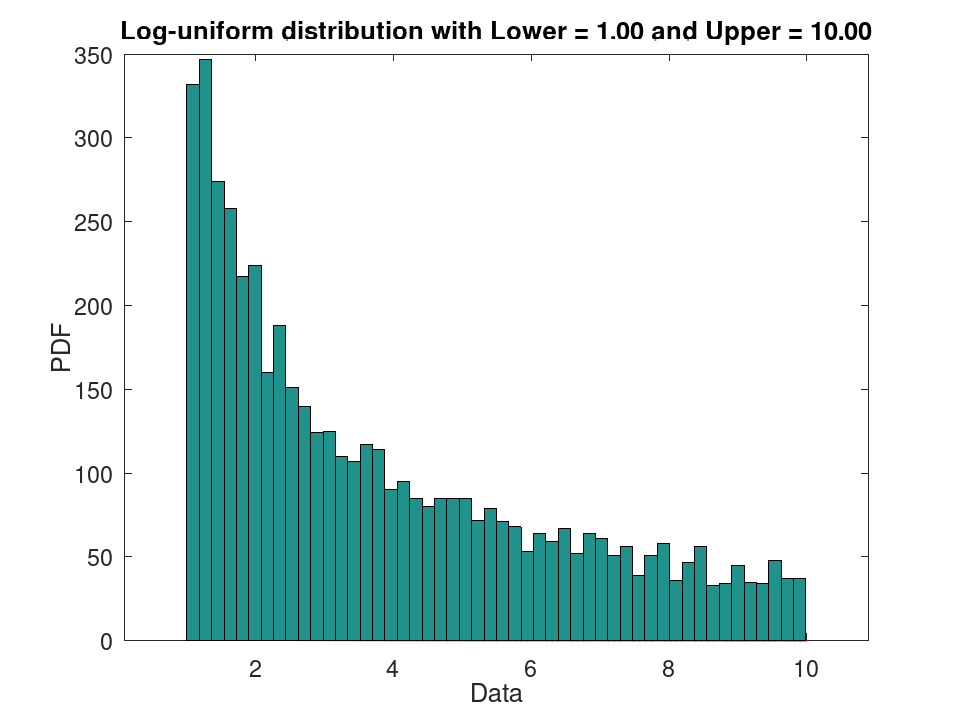
The prob.LoguniformDistribution class offers the following public methods:
prob.LoguniformDistribution: p = cdf (pd, x)
prob.LoguniformDistribution: p = cdf (pd, x, 'upper')
p = cdf (pd, x) computes the CDF of the
probability distribution object, pd, evaluated at the values in
x.
p = cdf (…, returns the complement of
the CDF of the probability distribution object, pd, evaluated at
the values in x.
'upper')
x must be double or single; integer, logical,
and character arrays are rejected.
Plot various CDFs from the Log-uniform distribution
 x = 0:0.01:10;
 pd1 = LoguniformDistribution (1, 4);
error: 'LoguniformDistribution' undefined near line 1, column 8

The 'LoguniformDistribution' function belongs to the 'statistics' package
indexed in Octave Packages at <https://packages.octave.org> but has not yet been
implemented.
 pd2 = LoguniformDistribution (1, 6);
 pd3 = LoguniformDistribution (1, 8);
 p1 = cdf (pd1, x);
 p2 = cdf (pd2, x);
 p3 = cdf (pd3, x);
 plot (x, p1, "-b", x, p2, "-g", x, p3, "-r")
 grid on
 legend ({"Lower=1, Upper=4", "Lower=1, Upper=6", "Lower=1, Upper=8"}, ...
         "location", "southeast")
 title ("Log-uniform CDF")
 xlabel ("values in x (Lower <= x <= Upper)")
 ylabel ("Cumulative probability")
Use this to compute and visualize the cumulative distribution function for different Log-uniform distributions, showing how probability accumulates over the range, useful in uncertainty modeling.
prob.LoguniformDistribution: x = icdf (pd, p)
x = icdf (pd, p) computes the quantile (the
inverse of the CDF) of the probability distribution object, pd,
evaluated at the values in p.
p must be double or single; integer, logical,
and character arrays are rejected.
Plot various iCDFs from the Log-uniform distribution
 p = 0.001:0.001:0.999;
 pd1 = LoguniformDistribution (1, 4);
error: 'LoguniformDistribution' undefined near line 1, column 8

The 'LoguniformDistribution' function belongs to the 'statistics' package
indexed in Octave Packages at <https://packages.octave.org> but has not yet been
implemented.
 pd2 = LoguniformDistribution (1, 6);
 pd3 = LoguniformDistribution (1, 8);
 x1 = icdf (pd1, p);
 x2 = icdf (pd2, p);
 x3 = icdf (pd3, p);
 plot (p, x1, "-b", p, x2, "-g", p, x3, "-r")
 grid on
 legend ({"Lower=1, Upper=4", "Lower=1, Upper=6", "Lower=1, Upper=8"}, ...
         "location", "northwest")
 title ("Log-uniform iCDF")
 xlabel ("Probability")
 ylabel ("values in x (Lower <= x <= Upper)")
This demonstrates the inverse CDF (quantiles) for Log-uniform distributions, useful for finding values at specific probabilities, such as in Monte Carlo simulations.
prob.LoguniformDistribution: r = iqr (pd)
r = iqr (pd) computes the interquartile range of the
probability distribution object, pd.
Compute the interquartile range for a Log-uniform distribution
pd = LoguniformDistribution (1, 10);
error: 'LoguniformDistribution' undefined near line 1, column 7

The 'LoguniformDistribution' function belongs to the 'statistics' package
indexed in Octave Packages at <https://packages.octave.org> but has not yet been
implemented.
iqr_value = iqr (pd)
Use this to calculate the interquartile range, measuring the spread of the middle 50% of the distribution on a log scale, helpful for robust statistics in skewed data.
prob.LoguniformDistribution: m = mean (pd)
m = mean (pd) computes the mean of the probability
distribution object, pd.
Compute the mean for different Log-uniform distributions
pd1 = LoguniformDistribution (1, 5);
error: 'LoguniformDistribution' undefined near line 1, column 8

The 'LoguniformDistribution' function belongs to the 'statistics' package
indexed in Octave Packages at <https://packages.octave.org> but has not yet been
implemented.
 pd2 = LoguniformDistribution (1, 10);
 mean1 = mean (pd1)
 mean2 = mean (pd2)
This shows how to compute the expected value for Log-uniform distributions with different upper limits, representing the average value over the range.
prob.LoguniformDistribution: m = median (pd)
m = median (pd) computes the median of the probability
distribution object, pd.
Compute the median for different Log-uniform distributions
pd1 = LoguniformDistribution (1, 5);
error: 'LoguniformDistribution' undefined near line 1, column 8

The 'LoguniformDistribution' function belongs to the 'statistics' package
indexed in Octave Packages at <https://packages.octave.org> but has not yet been
implemented.
 pd2 = LoguniformDistribution (1, 10);
 median1 = median (pd1)
 median2 = median (pd2)
Use this to find the median value, which is the geometric mean of the bounds, splitting the distribution into equal probability halves.
prob.LoguniformDistribution: y = pdf (pd, x)
y = pdf (pd, x) computes the PDF of the
probability distribution object, pd, evaluated at the values in
x.
x must be double or single; integer, logical,
and character arrays are rejected.
Plot various PDFs from the Log-uniform distribution
 x = 0.1:0.01:10;
 pd1 = LoguniformDistribution (1, 4);
error: 'LoguniformDistribution' undefined near line 1, column 8

The 'LoguniformDistribution' function belongs to the 'statistics' package
indexed in Octave Packages at <https://packages.octave.org> but has not yet been
implemented.
 pd2 = LoguniformDistribution (1, 6);
 pd3 = LoguniformDistribution (1, 8);
 y1 = pdf (pd1, x);
 y2 = pdf (pd2, x);
 y3 = pdf (pd3, x);
 plot (x, y1, "-b", x, y2, "-g", x, y3, "-r")
 grid on
 legend ({"Lower=1, Upper=4", "Lower=1, Upper=6", "Lower=1, Upper=8"}, ...
         "location", "northeast")
 title ("Log-uniform PDF")
 xlabel ("values in x (Lower <= x <= Upper)")
 ylabel ("Probability density")
This visualizes the probability density function for Log-uniform distributions, showing the likelihood decreasing inversely with x.
prob.LoguniformDistribution: plot (pd)
prob.LoguniformDistribution: plot (pd, Name, Value)
prob.LoguniformDistribution: h = plot (…)
plot (pd) plots a probability density function (PDF) of the
probability distribution object pd.
plot (pd, Name, Value) specifies additional
options with the Name-Value pair arguments listed below.
| Name | Value |
|---|---|
'PlotType' | A character vector specifying the plot
type. 'pdf' plots the probability density function (PDF).
'cdf' plots the cumulative density function (CDF). |
'Discrete' | A logical scalar to specify whether to
plot the PDF or CDF of a discrete distribution object as a line plot or a
stem plot, by specifying false or true, respectively. By
default, it is true for discrete distributions and false
for continuous distributions. When pd is a continuous distribution
object, option is ignored. |
'Parent' | An axes graphics object for plot. If
not specified, the plot function plots into the current axes or
creates a new axes object if one does not exist. |
h = plot (…) returns a graphics handle to the plotted
objects.
Create a Log-uniform distribution with fixed parameters Lower=1 and Upper=4 and plot its PDF.
pd = LoguniformDistribution (1, 4);
error: 'LoguniformDistribution' undefined near line 1, column 7

The 'LoguniformDistribution' function belongs to the 'statistics' package
indexed in Octave Packages at <https://packages.octave.org> but has not yet been
implemented.
 plot (pd)
 title ("Fixed Log-uniform distribution with Lower=1 and Upper=4")
Generate a data set of 100 random samples from a Log-uniform distribution with parameters Lower=1 and Upper=10. Plot its CDF.
 rng (42);
 data = exp (unifrnd (log (1), log (10), 100, 1));
 pd = LoguniformDistribution (1, 10);
error: 'LoguniformDistribution' undefined near line 1, column 7

The 'LoguniformDistribution' function belongs to the 'statistics' package
indexed in Octave Packages at <https://packages.octave.org> but has not yet been
implemented.
 plot (pd, "PlotType", "cdf")
 title ("Log-uniform distribution with Lower=1 and Upper=10")
Use this to visualize the CDF, useful for understanding cumulative probabilities in the distribution.
prob.LoguniformDistribution: r = random (pd)
prob.LoguniformDistribution: r = random (pd, rows)
prob.LoguniformDistribution: r = random (pd, rows, cols, …)
prob.LoguniformDistribution: r = random (pd, [sz])
r = random (pd) returns a random number from the
distribution object pd.
When called with a single size argument, random returns a square
matrix with the dimension specified. When called with more than one
scalar argument, the first two arguments are taken as the number of rows
and columns and any further arguments specify additional matrix
dimensions. The size may also be specified with a row vector of
dimensions, sz.
Generate random samples from a Log-uniform distribution
 rng (42);
 pd = LoguniformDistribution (1, 10);
error: 'LoguniformDistribution' undefined near line 1, column 7

The 'LoguniformDistribution' function belongs to the 'statistics' package
indexed in Octave Packages at <https://packages.octave.org> but has not yet been
implemented.
 samples = random (pd, 500, 1);
 hist (samples, 50)
 title ("Histogram of 500 random samples from Log-uniform(Lower=1, Upper=10)")
 xlabel ("values in x (Lower <= x <= Upper)")
 ylabel ("Frequency")
This generates random samples from a Log-uniform distribution, useful for simulating data uniform on a log scale, like in power-law phenomena.
prob.LoguniformDistribution: s = std (pd)
s = std (pd) computes the standard deviation of the
probability distribution object, pd.
Compute the standard deviation for a Log-uniform distribution
pd = LoguniformDistribution (1, 10);
error: 'LoguniformDistribution' undefined near line 1, column 7

The 'LoguniformDistribution' function belongs to the 'statistics' package
indexed in Octave Packages at <https://packages.octave.org> but has not yet been
implemented.
std_value = std (pd)
Use this to calculate the standard deviation, measuring the variability in the distribution's values.
prob.LoguniformDistribution: t = truncate (pd, lower, upper)
t = truncate (pd, lower, upper) returns a
probability distribution t, which is the probability distribution
pd truncated to the specified interval with lower limit,
lower, and upper limit, upper.
Plot the PDF of a Log-uniform distribution, with parameters Lower=1 and Upper=10, truncated at [2, 5] intervals. Generate 10000 random samples from this truncated distribution and superimpose a histogram scaled accordingly
 rng (42);
 data_all = exp (unifrnd (log (1), log (10), 20000, 1));
 data = data_all(data_all >= 2 & data_all <= 5);
 data = data(1:7500);
 pd = LoguniformDistribution (1, 10);
error: 'LoguniformDistribution' undefined near line 1, column 7

The 'LoguniformDistribution' function belongs to the 'statistics' package
indexed in Octave Packages at <https://packages.octave.org> but has not yet been
implemented.
 t = truncate (pd, 2, 5);
 [counts, centers] = hist (data, 50);
 bin_width = centers(2) - centers(1);
 bar (centers, counts / (sum (counts) * bin_width), 1);
 hold on;
Plot histogram and truncated PDF
 x = linspace (0.5, 5, 500);
 y = pdf (t, x);
 plot (x, y, "r", "linewidth", 2);
 title ("Log-uniform distribution (Lower=1, Upper=10) truncated at [2, 5]")
 legend ("Truncated PDF", "Histogram")
This demonstrates truncating a Log-uniform distribution to a specific range and visualizing the resulting distribution with random samples.
prob.LoguniformDistribution: v = var (pd)
v = var (pd) computes the variance of the
probability distribution object, pd.
Compute the variance for a Log-uniform distribution
pd = LoguniformDistribution (1, 10);
error: 'LoguniformDistribution' undefined near line 1, column 7

The 'LoguniformDistribution' function belongs to the 'statistics' package
indexed in Octave Packages at <https://packages.octave.org> but has not yet been
implemented.
var_value = var (pd)
Use this to calculate the variance, quantifying the spread of the values in the distribution.
Examples
 rng (42);
 randg ('state', 42);
 rande ('state', 42);
 randp ('state', 42);
 pd_fixed = makedist ('Loguniform', 'Lower', 1, 'Upper', 10);
 data = random (pd_fixed, 5000, 1);
 plot (pd_fixed)
 hold on
 hist (data, 50)
 hold off
 msg = 'Log-uniform distribution with Lower = %0.2f and Upper = %0.2f';
 title (sprintf (msg, pd_fixed.Lower, pd_fixed.Upper))