Categories &
Functions List
- adtest
- anova
- anova1
- anova2
- anovan
- ansaribradley
- barttest
- binotest
- chi2gof
- chi2test
- correlation_test
- detectdrift
- dwtest
- fishertest
- friedman
- hotelling_t2test
- hotelling_t2test2
- jbtest
- knntest
- kruskalwallis
- kstest
- kstest2
- lillietest
- manova1
- mcnemar_test
- meanEffectSize
- mmdtest
- multcompare
- ranksum
- regression_ftest
- regression_ttest
- runstest
- signrank
- signtest
- stats.drift.DriftDiagnostics
- swtest
- ttest
- ttest2
- vartest
- vartest2
- vartestn
- ztest
- ztest2
- CompactLinearModel
- CoxModel
- coxphfit
- fitcox
- fitglm
- fitglme
- fitlm
- fitlme
- fitlmematrix
- fitnlm
- fitrm
- GeneralizedLinearMixedModel
- GeneralizedLinearModel
- glmfit
- glmval
- invpred
- lasso
- lassoglm
- LinearFormula
- LinearMixedModel
- LinearModel
- logistic_regression
- mnrfit
- mnrval
- monotone_smooth
- mvregress
- mvregresslike
- nlinfit
- nlparci
- nlpredci
- NonLinearModel
- plsregress
- regress
- regress_gp
- RepeatedMeasuresModel
- ridge
- robustfit
- stepwisefit
- stepwiseglm
- stepwiselm
- ClassificationBaggedEnsemble
- ClassificationDiscriminant
- ClassificationECOC
- ClassificationEnsemble
- ClassificationGAM
- ClassificationKernel
- ClassificationKNN
- ClassificationLinear
- ClassificationNaiveBayes
- ClassificationNeuralNetwork
- ClassificationPartitionedECOC
- ClassificationPartitionedEnsemble
- ClassificationPartitionedKernel
- ClassificationPartitionedLinear
- ClassificationPartitionedModel
- ClassificationSVM
- ClassificationTree
- CompactClassificationDiscriminant
- CompactClassificationECOC
- CompactClassificationEnsemble
- CompactClassificationGAM
- CompactClassificationNaiveBayes
- CompactClassificationNeuralNetwork
- CompactClassificationSVM
- CompactClassificationTree
- CompactRegressionGAM
- CompactRegressionEnsemble
- CompactRegressionGP
- CompactRegressionNeuralNetwork
- CompactRegressionSVM
- CompactRegressionTree
- CompactTreeBagger
- designecoc
- fcnnpredict
- fcnntrain
- fitcdiscr
- fitcecoc
- fitcensemble
- fitcgam
- fitckernel
- fitcknn
- fitclinear
- fitcnb
- fitcnet
- fitcsvm
- fitctree
- fitrensemble
- fitrgam
- fitrgp
- fitrkernel
- fitrlinear
- fitrnet
- fitrsvm
- fitrtree
- gamboostinter
- gamboostpairs
- gamboostpredict
- gamboosttrain
- gampredict
- gamtrain
- partialDependence
- plotPartialDependence
- PredictiveModel
- RegressionBaggedEnsemble
- RegressionEnsemble
- RegressionGAM
- RegressionGP
- RegressionKernel
- RegressionLinear
- RegressionNeuralNetwork
- RegressionPartitionedEnsemble
- RegressionPartitionedKernel
- RegressionPartitionedLinear
- RegressionPartitionedModel
- RegressionSVM
- RegressionTree
- lime
- shapley
- svmpredict
- svmtrain
- templateDiscriminant
- templateEnsemble
- templateKernel
- templateKNN
- templateLinear
- templateNaiveBayes
- templateSVM
- templateTree
- TreeBagger
- treepredict
- treetrain
- paretotails
- prob.ProbabilityDistribution
- prob.BetaDistribution
- prob.BinomialDistribution
- prob.BirnbaumSaundersDistribution
- prob.BurrDistribution
- prob.ExponentialDistribution
- prob.ExtremeValueDistribution
- prob.GammaDistribution
- prob.GeneralizedExtremeValueDistribution
- prob.GeneralizedParetoDistribution
- prob.HalfNormalDistribution
- prob.InverseGaussianDistribution
- prob.KernelDistribution
- prob.LogisticDistribution
- prob.LoglogisticDistribution
- prob.LognormalDistribution
- prob.LoguniformDistribution
- prob.MultinomialDistribution
- prob.NakagamiDistribution
- prob.NegativeBinomialDistribution
- prob.NormalDistribution
- prob.PiecewiseLinearDistribution
- prob.PoissonDistribution
- prob.RayleighDistribution
- prob.RicianDistribution
- prob.StableDistribution
- prob.tLocationScaleDistribution
- prob.TriangularDistribution
- prob.UniformDistribution
- prob.WeibullDistribution
- betafit
- betalike
- binofit
- binolike
- bisafit
- bisalike
- burrfit
- burrlike
- copulafit
- evfit
- evlike
- expfit
- explike
- gamfit
- gamlike
- geofit
- gevfit
- gevlike
- gevfit_lmom
- gpfit
- gplike
- gumbelfit
- gumbellike
- hnfit
- hnlike
- invgfit
- invglike
- logifit
- logilike
- loglfit
- logllike
- lognfit
- lognlike
- nakafit
- nakalike
- nbinfit
- nbinlike
- normfit
- normlike
- poissfit
- poisslike
- raylfit
- rayllike
- ricefit
- ricelike
- stblfit
- stbllike
- tlsfit
- tlslike
- unidfit
- unifit
- wblfit
- wbllike
- betacdf
- betainv
- betapdf
- betarnd
- binocdf
- binoinv
- binopdf
- binornd
- bisacdf
- bisainv
- bisapdf
- bisarnd
- burrcdf
- burrinv
- burrpdf
- burrrnd
- bvncdf
- bvtcdf
- cauchycdf
- cauchyinv
- cauchypdf
- cauchyrnd
- chi2cdf
- chi2inv
- chi2pdf
- chi2rnd
- copulacdf
- copulapdf
- copularnd
- evcdf
- evinv
- evpdf
- evrnd
- expcdf
- expinv
- exppdf
- exprnd
- fcdf
- finv
- fpdf
- frnd
- gamcdf
- gaminv
- gampdf
- gamrnd
- geocdf
- geoinv
- geopdf
- geornd
- gevcdf
- gevinv
- gevpdf
- gevrnd
- gpcdf
- gpinv
- gppdf
- gprnd
- gumbelcdf
- gumbelinv
- gumbelpdf
- gumbelrnd
- hncdf
- hninv
- hnpdf
- hnrnd
- hygecdf
- hygeinv
- hygepdf
- hygernd
- invgcdf
- invginv
- invgpdf
- invgrnd
- iwishpdf
- iwishrnd
- jsucdf
- jsupdf
- laplacecdf
- laplaceinv
- laplacepdf
- laplacernd
- logicdf
- logiinv
- logipdf
- logirnd
- loglcdf
- loglinv
- loglpdf
- loglrnd
- logncdf
- logninv
- lognpdf
- lognrnd
- mnpdf
- mnrnd
- mvncdf
- mvnpdf
- mvnrnd
- mvtcdf
- mvtpdf
- mvtrnd
- nakacdf
- nakainv
- nakapdf
- nakarnd
- nbincdf
- nbininv
- nbinpdf
- nbinrnd
- ncfcdf
- ncfinv
- ncfpdf
- ncfrnd
- nctcdf
- nctinv
- nctpdf
- nctrnd
- ncx2cdf
- ncx2inv
- ncx2pdf
- ncx2rnd
- normcdf
- norminv
- normpdf
- normrnd
- plcdf
- plinv
- plpdf
- plrnd
- poisscdf
- poissinv
- poisspdf
- poissrnd
- raylcdf
- raylinv
- raylpdf
- raylrnd
- ricecdf
- riceinv
- ricepdf
- ricernd
- stblcdf
- stblinv
- stblpdf
- stblrnd
- stdrcdf
- stdrinv
- stdrpdf
- stdrrnd
- tcdf
- tinv
- tpdf
- trnd
- tlscdf
- tlsinv
- tlspdf
- tlsrnd
- tricdf
- triinv
- tripdf
- trirnd
- unidcdf
- unidinv
- unidpdf
- unidrnd
- unifcdf
- unifinv
- unifpdf
- unifrnd
- vmcdf
- vminv
- vmpdf
- vmrnd
- wblcdf
- wblinv
- wblpdf
- wblrnd
- wienrnd
- wishpdf
- wishrnd
- betastat
- binostat
- bisastat
- burrstat
- chi2stat
- copulaparam
- copulastat
- evstat
- expstat
- fstat
- gamstat
- geostat
- gevstat
- gpstat
- gumbelstat
- hnstat
- hygestat
- invgstat
- logistat
- loglstat
- lognstat
- nakastat
- nbinstat
- ncfstat
- nctstat
- ncx2stat
- normstat
- plstat
- poisstat
- raylstat
- ricestat
- stdrstat
- tlsstat
- tristat
- tstat
- unidstat
- unifstat
- wblstat
- andrewsplot
- bar3
- bar3h
- biplot
- boxchart
- boxplot
- cdfplot
- dendrogram
- ecdfhist
- einstein
- gardnerAltmanPlot
- glyphplot
- gplotmatrix
- gscatter
- heatmap
- hist3
- histfit
- manovacluster
- normplot
- parallelcoords
- parallelplot
- ppplot
- probplot
- qqplot
- scatterhist
- scatterhistogram
- silhouette
- stats.chart.BoxChart
- stats.chart.HeatmapChart
- stats.chart.ParallelCoordinatesPlot
- stats.chart.ScatterHistogramChart
- swarmchart
- violin
- wblplot
Class Definition: TreeBagger
statistics: TreeBagger
Ensemble of bagged decision trees
A TreeBagger object is a random forest: an ensemble of decision
trees, each grown on a bootstrap sample of the training data and each
choosing every split from a random subset of the predictors. The
ensemble predicts by averaging its trees, their class probabilities for
classification and their responses for regression.
Every observation a tree’s sample leaves out is out of bag for that tree, and the out-of-bag methods judge the ensemble on those observations alone, giving an estimate of its error on new data without a separate test set.
Create one with the TreeBagger constructor. The compact
method drops the training data and returns a CompactTreeBagger.
See also: CompactTreeBagger, ClassificationTree, RegressionTree, fitctree, fitrtree
Source Code: TreeBagger
The TreeBagger class contains the following properties:
'classification' or 'regression'. This property is
read-only.
Grow a random forest on the iris data, estimate its error from the observations each tree left out, and classify a new flower.
 load fisheriris
 rng (42);
 B = TreeBagger (50, meas, species, 'OOBPrediction', 'on');
 err = oobError (B);
 err(end)
ans = 0.053333
label = predict (B, [5.8, 2.8, 4.5, 1.4])
label =
  1x1 cell array

    {'versicolor'}
A regression forest predicting sepal length from the other three measurements, with the spread of its trees around each prediction.
 load fisheriris
 rng (42);
 B = TreeBagger (50, meas(:,2:4), meas(:,1), 'Method', 'regression');
 [yfit, sd] = predict (B, meas([1, 51, 101], 2:4))
yfit =

   5.0382
   6.5283
   6.8350

sd =

   0.1101
   0.1816
   0.3976
A 90% prediction interval for sepal length from the other three measurements, read off the quantiles of a regression forest.
 load fisheriris
 rng (42);
 B = TreeBagger (100, meas(:,2:4), meas(:,1), 'Method', 'regression');
 q = quantilePredict (B, meas([1, 51, 101], 2:4), ...
                      'Quantile', [0.05, 0.5, 0.95])
q =

   4.6000   5.0463   5.5000
   5.9000   6.5334   7.0853
   6.2196   6.7508   7.7000
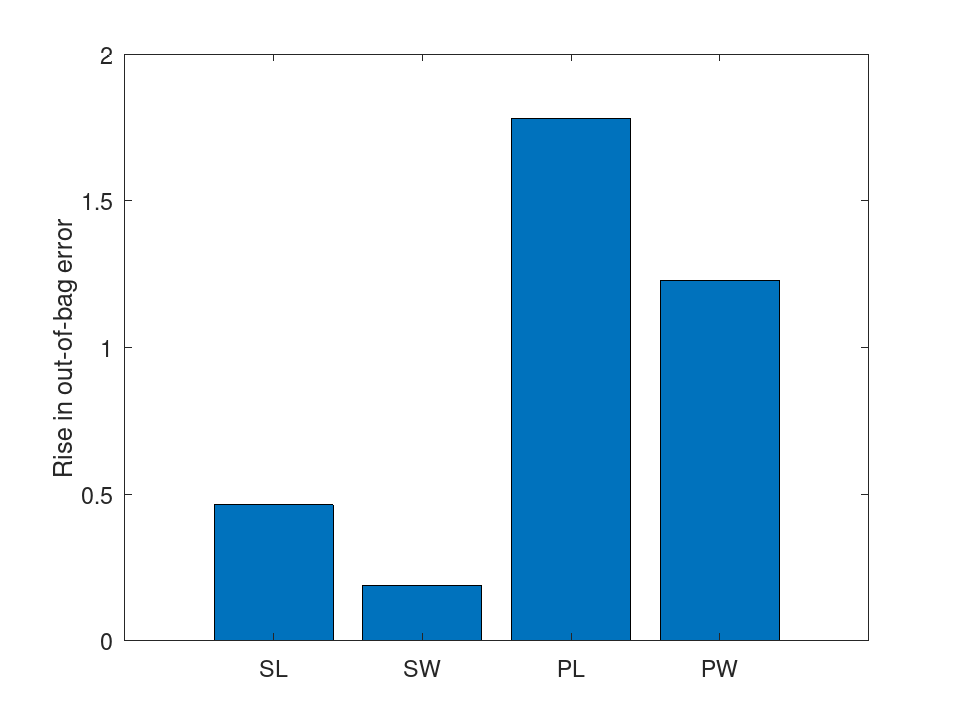
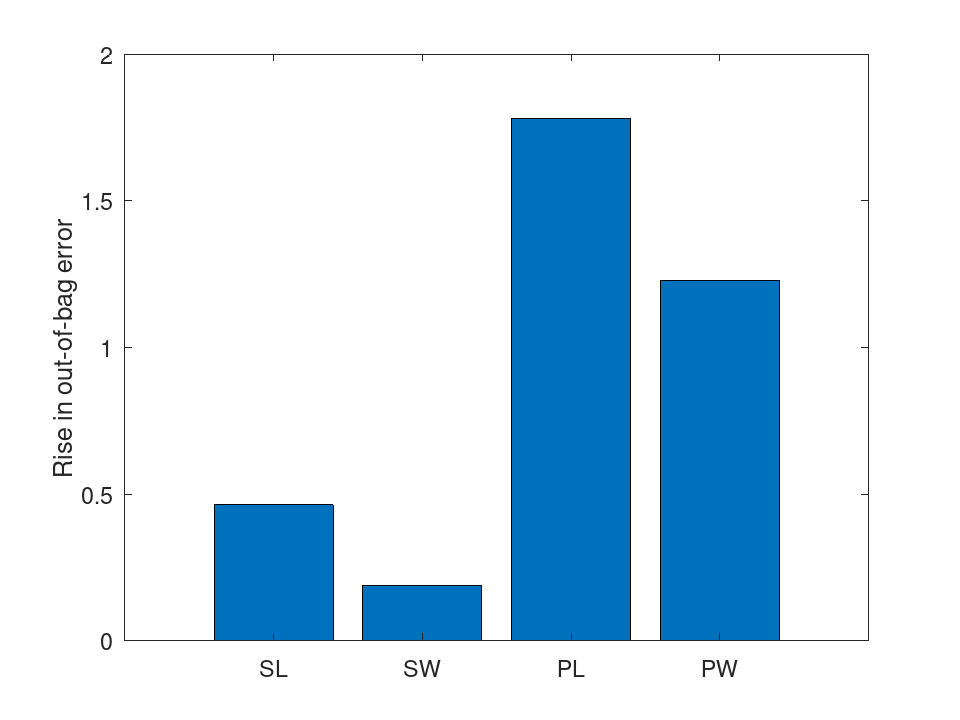
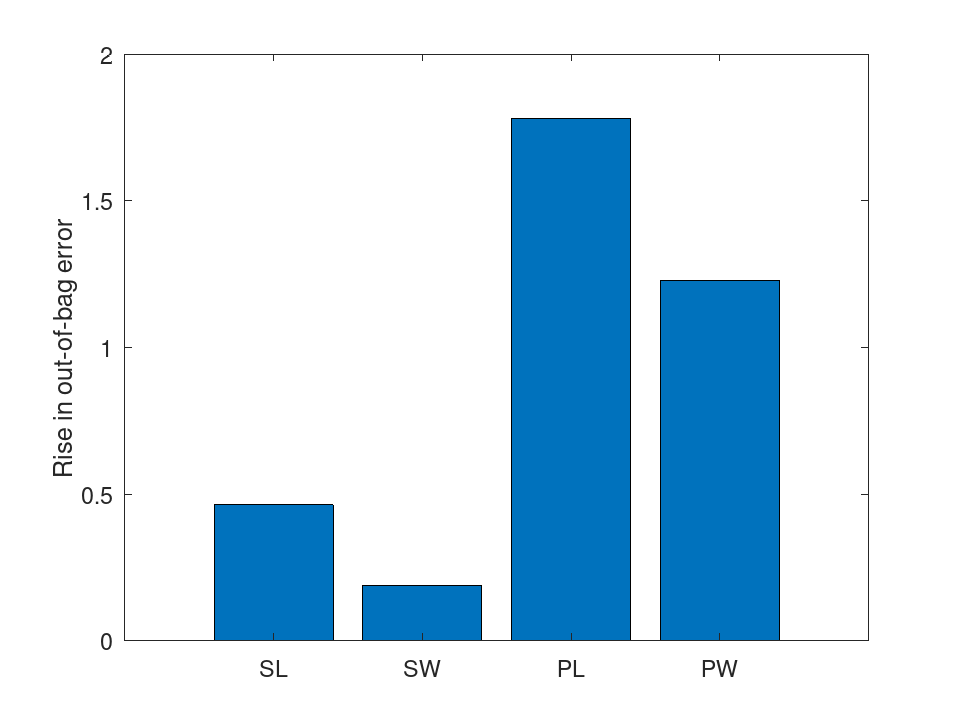
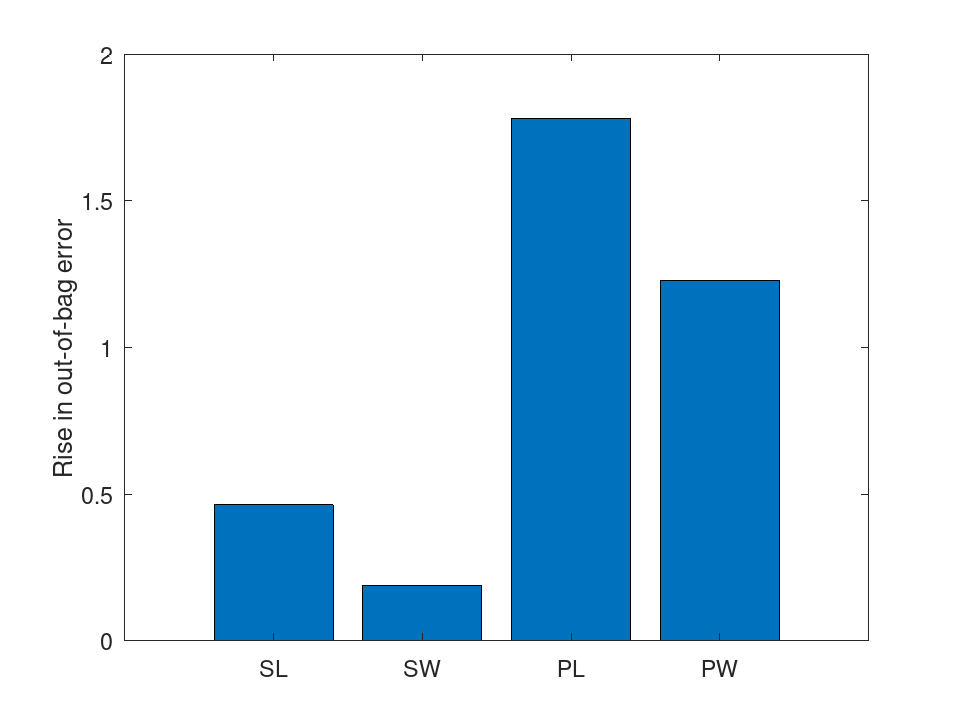
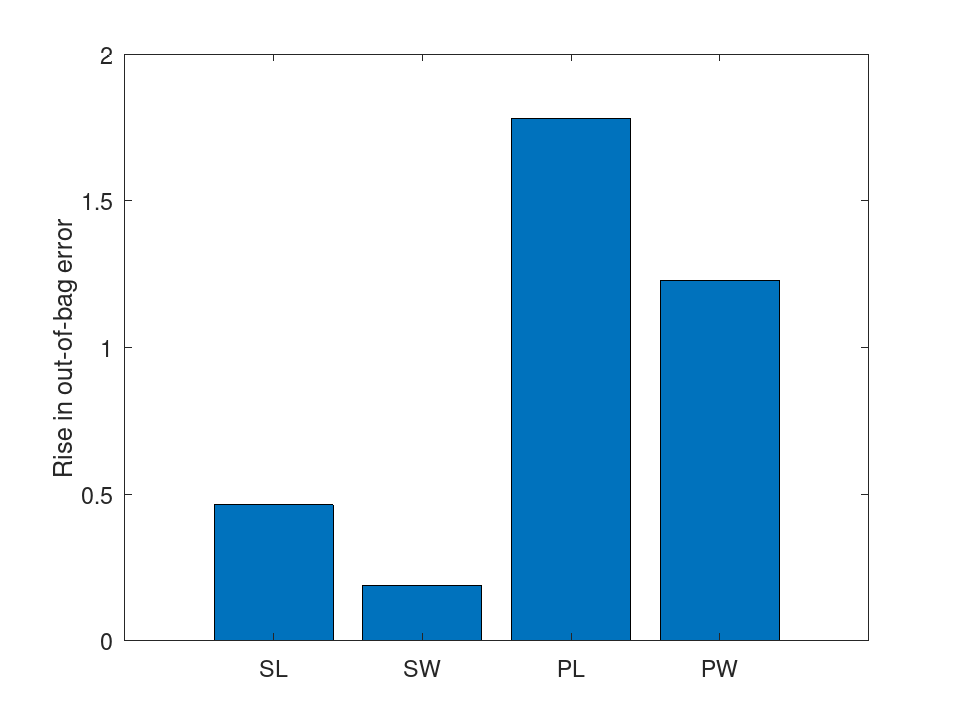
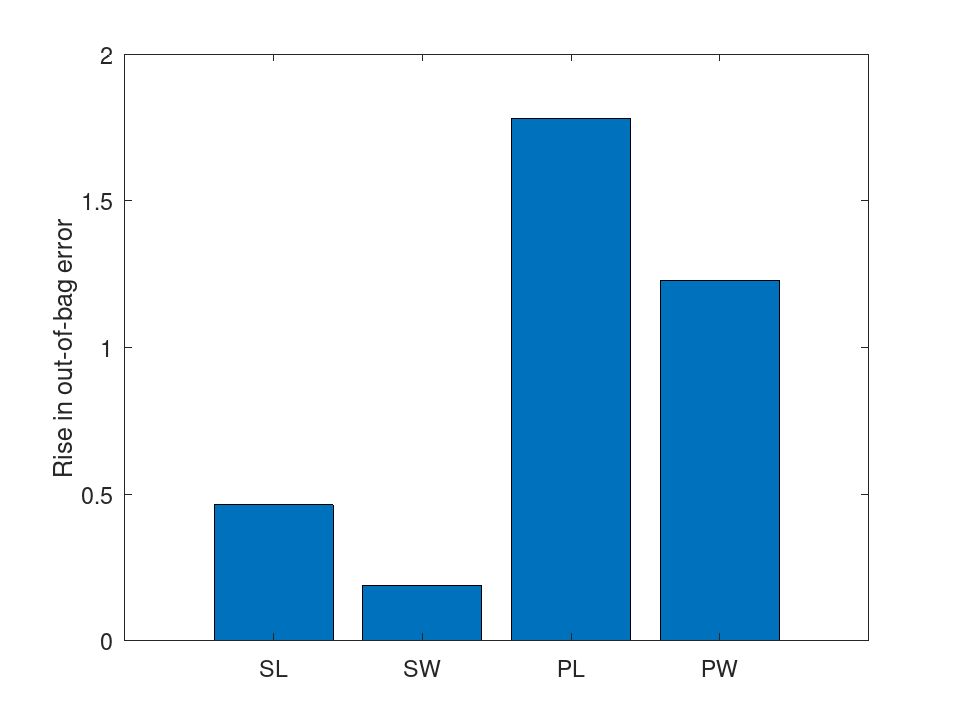
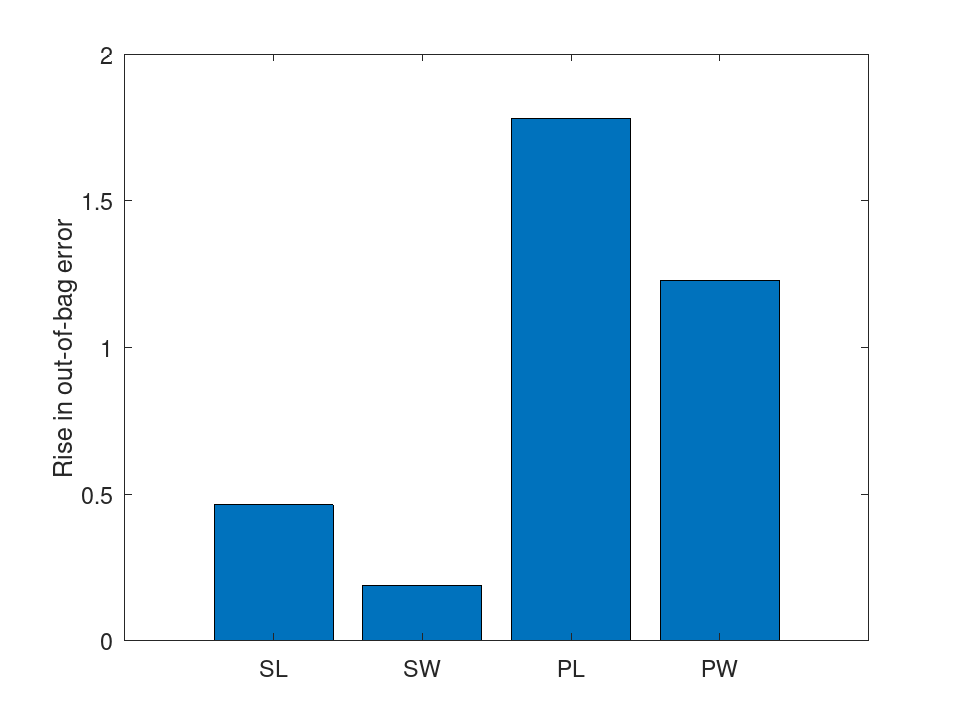
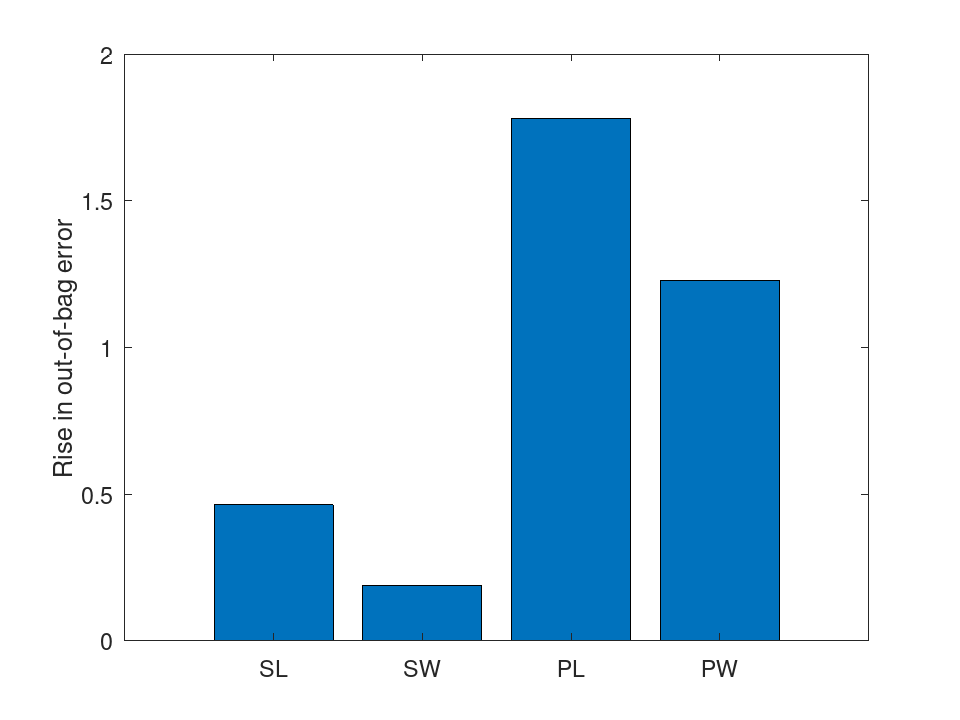
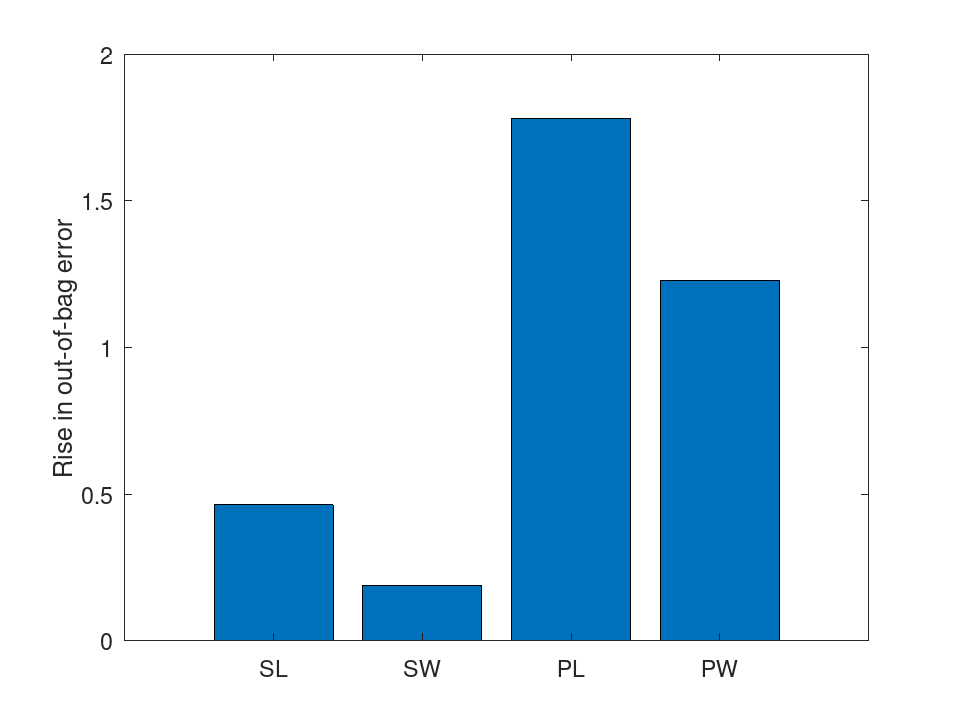
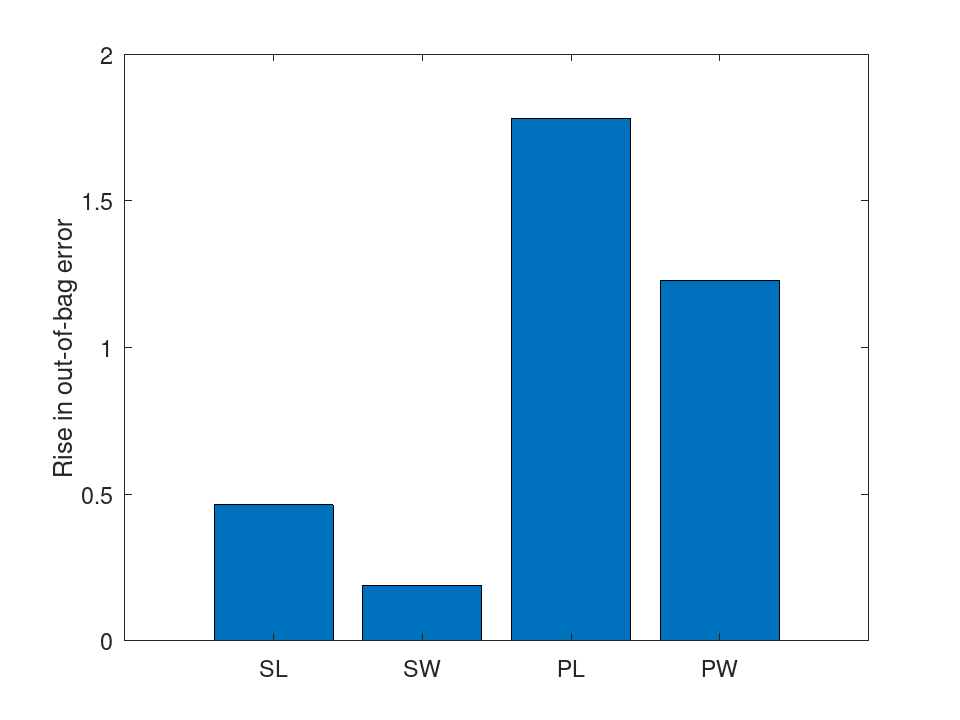
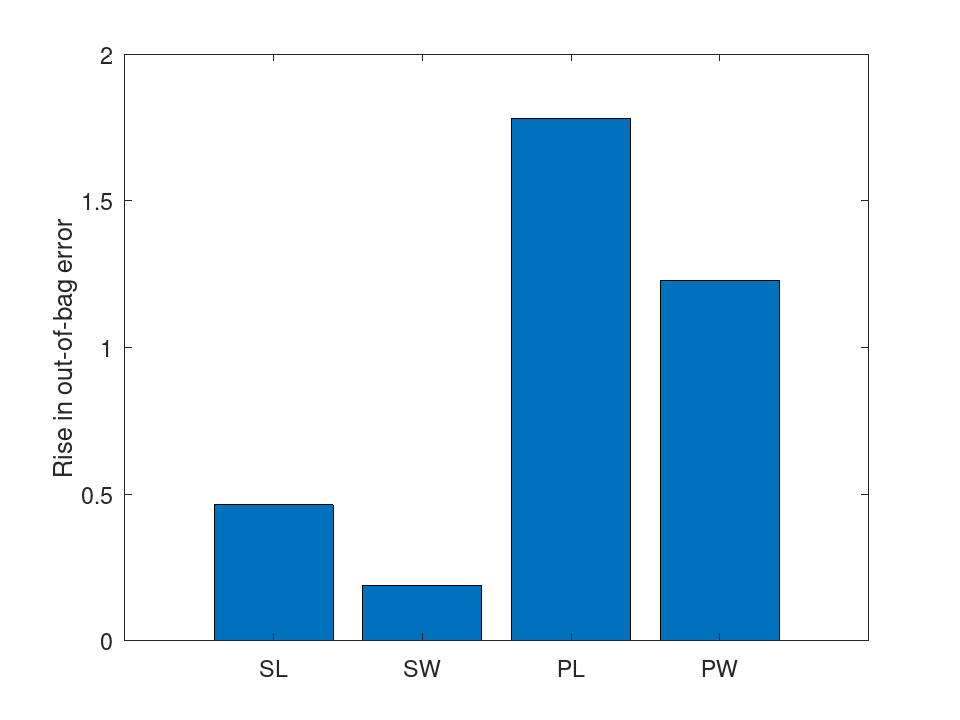
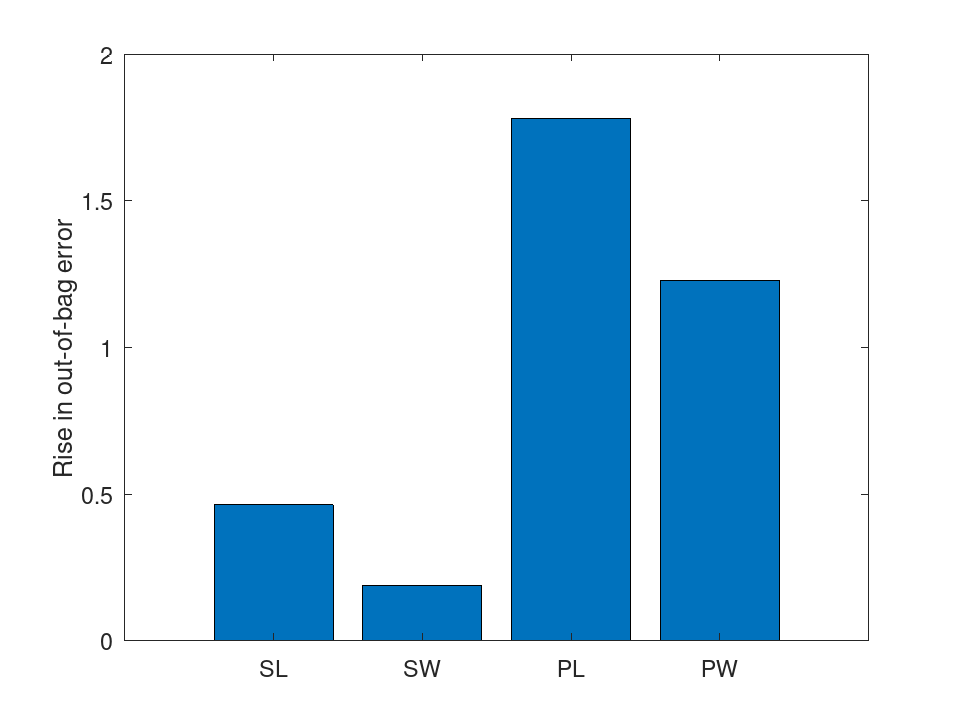
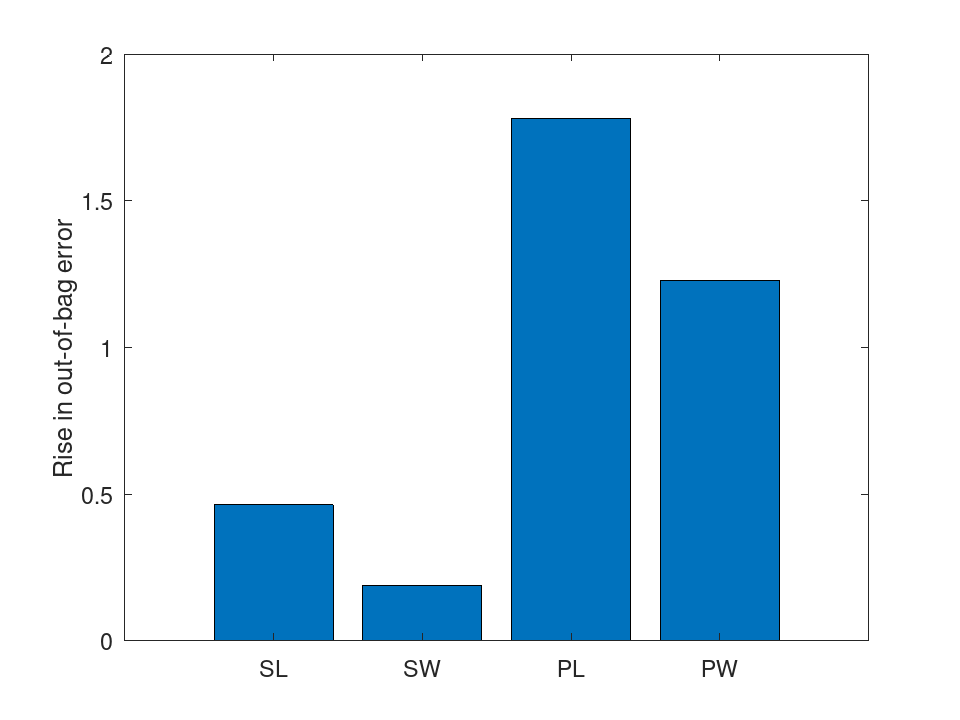
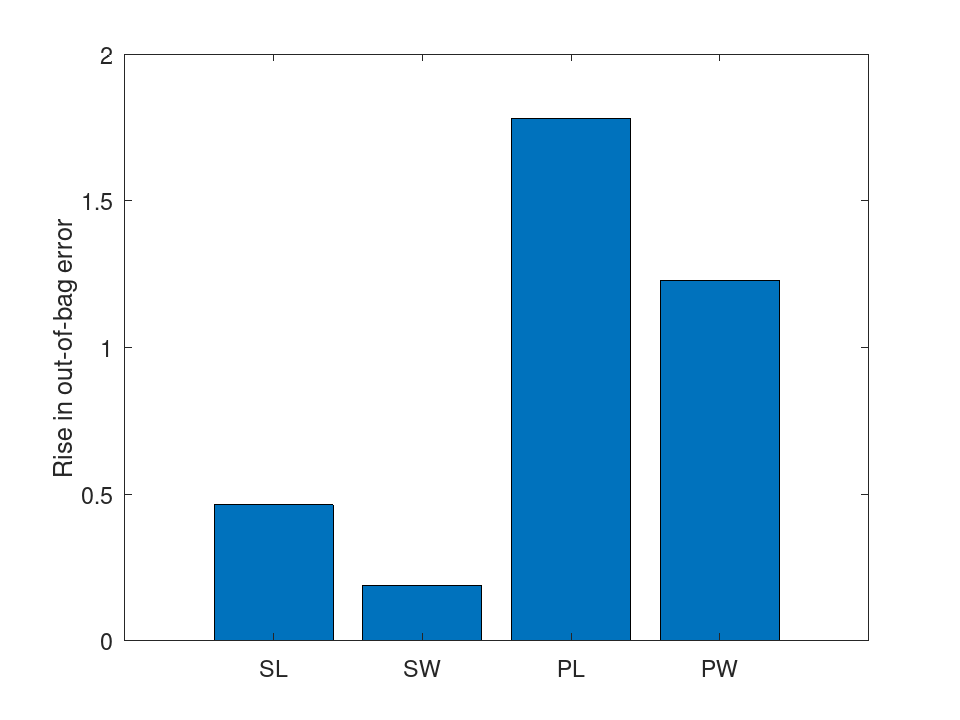
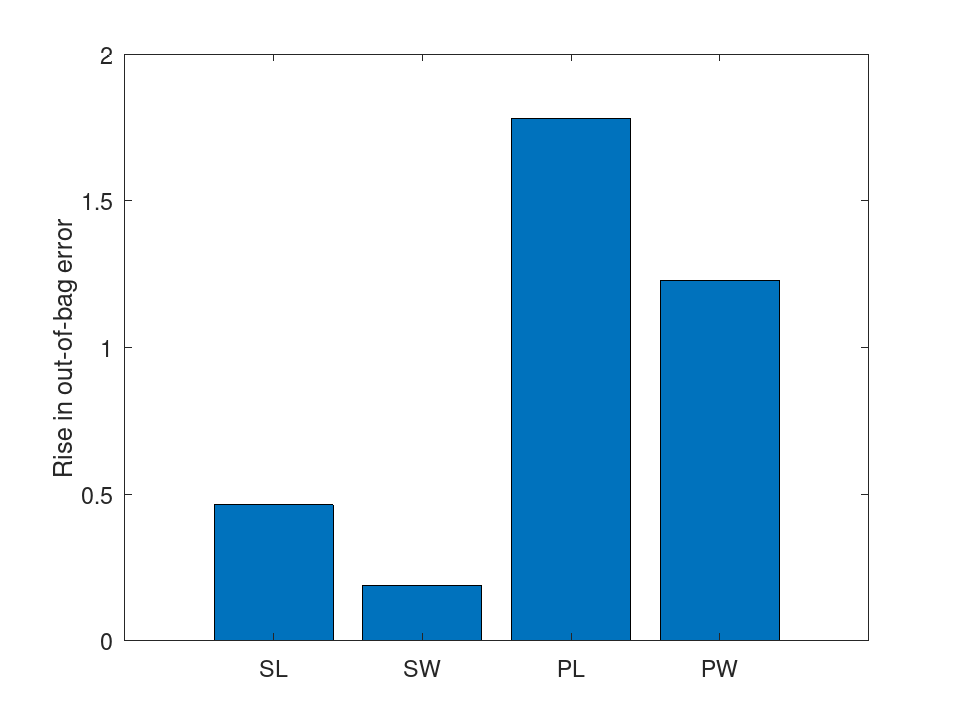
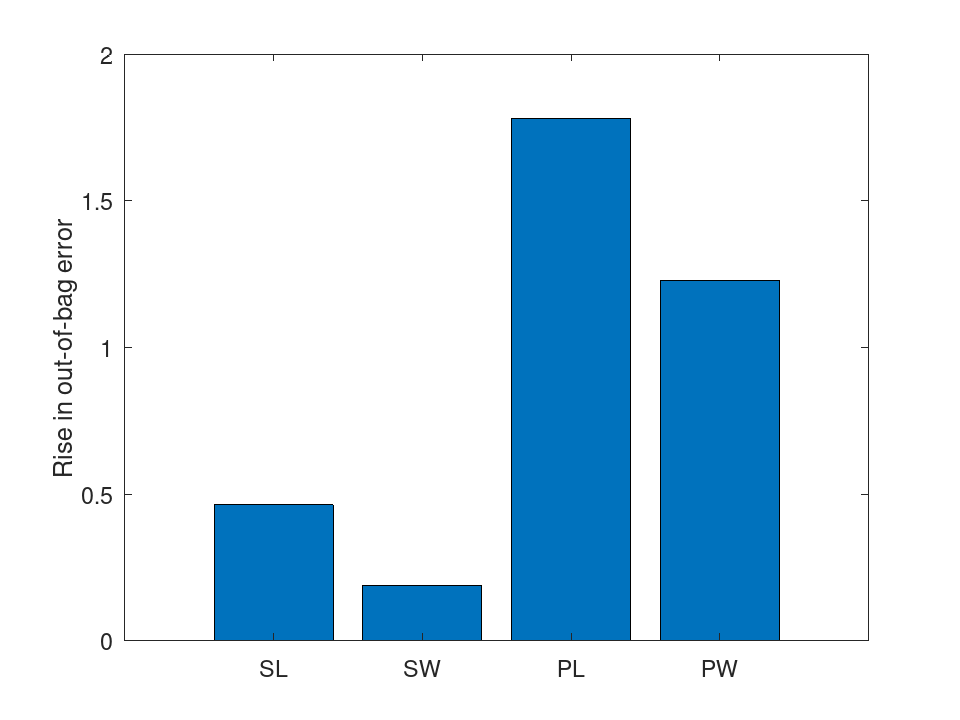
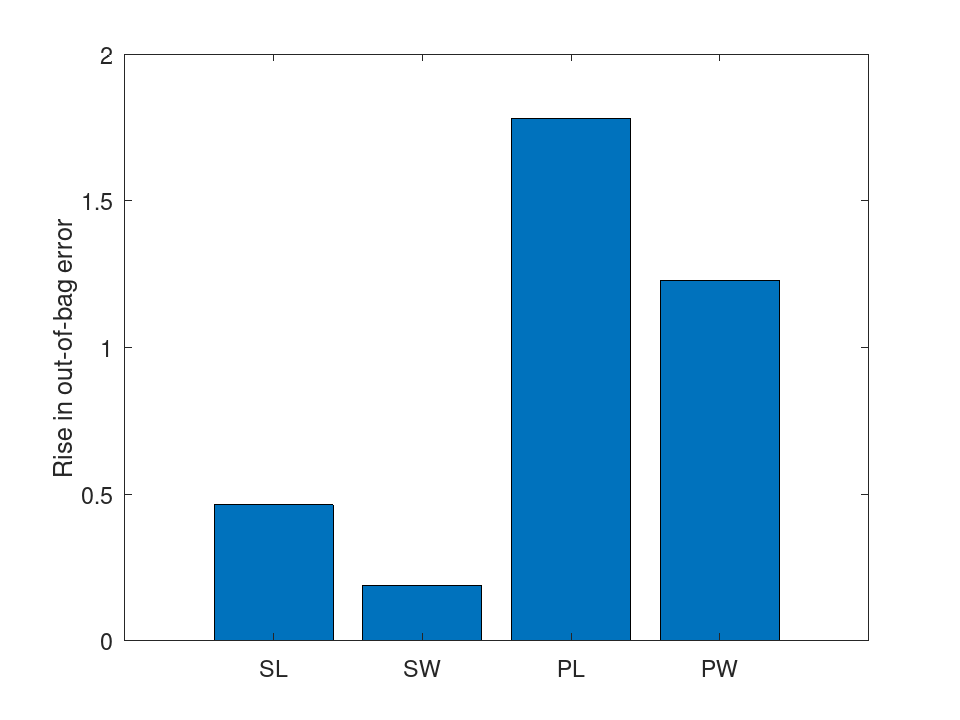
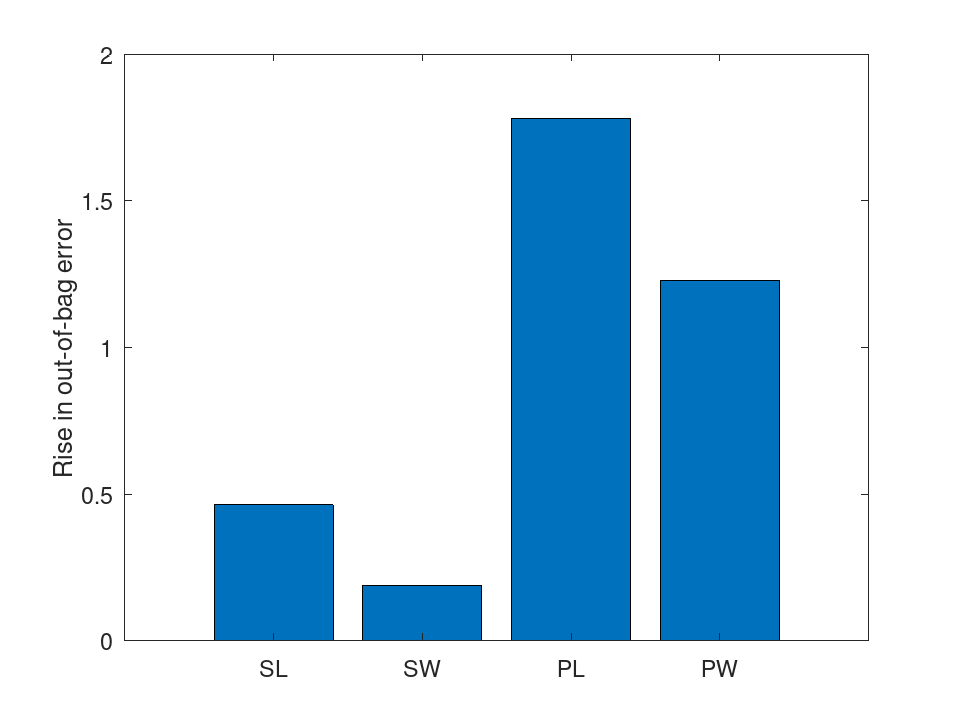
Which measurements a forest relies on: permuting a petal measurement among each tree's out-of-bag flowers raises the error the most.
 load fisheriris
 rng (42);
 B = TreeBagger (50, meas, species, 'OOBPredictorImportance', 'on');
 bar (B.OOBPermutedPredictorDeltaError);
 set (gca, 'xticklabel', {'SL', 'SW', 'PL', 'PW'});
 ylabel ('Rise in out-of-bag error');
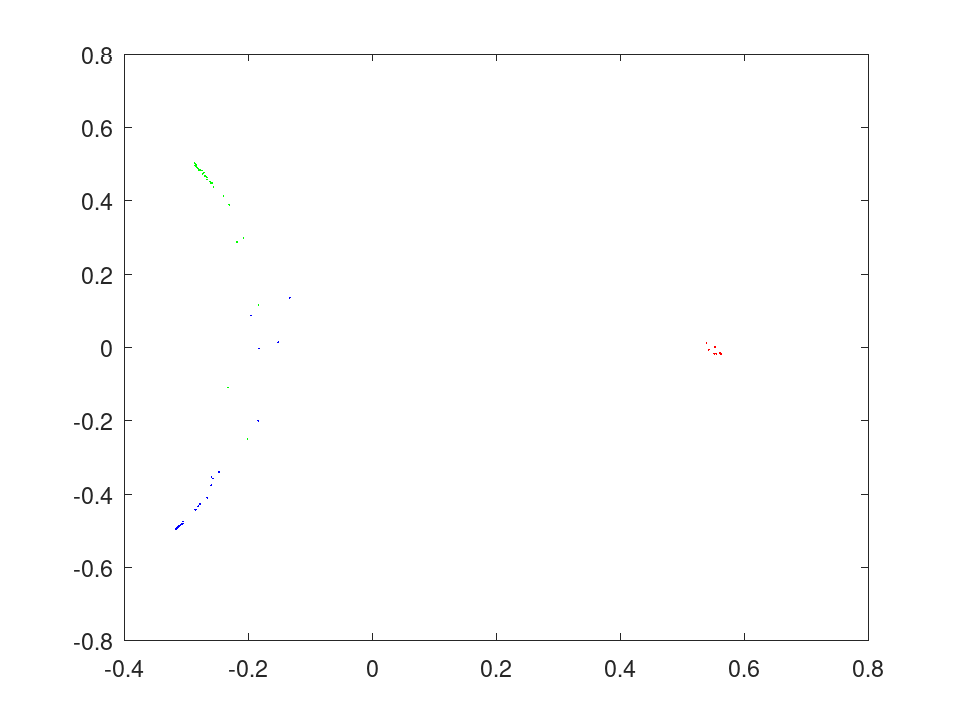
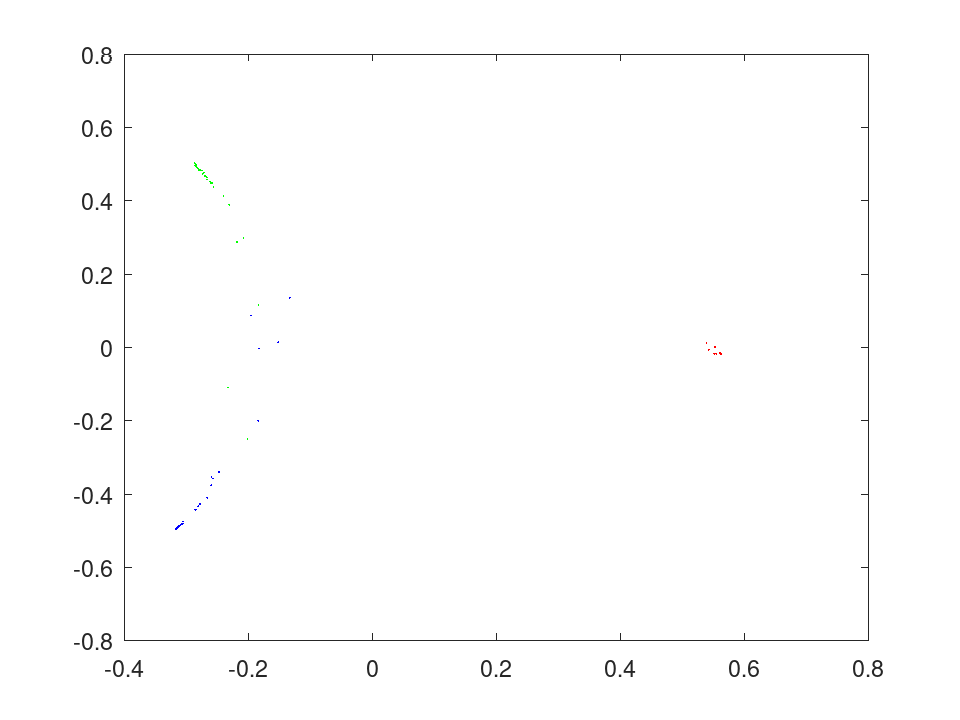
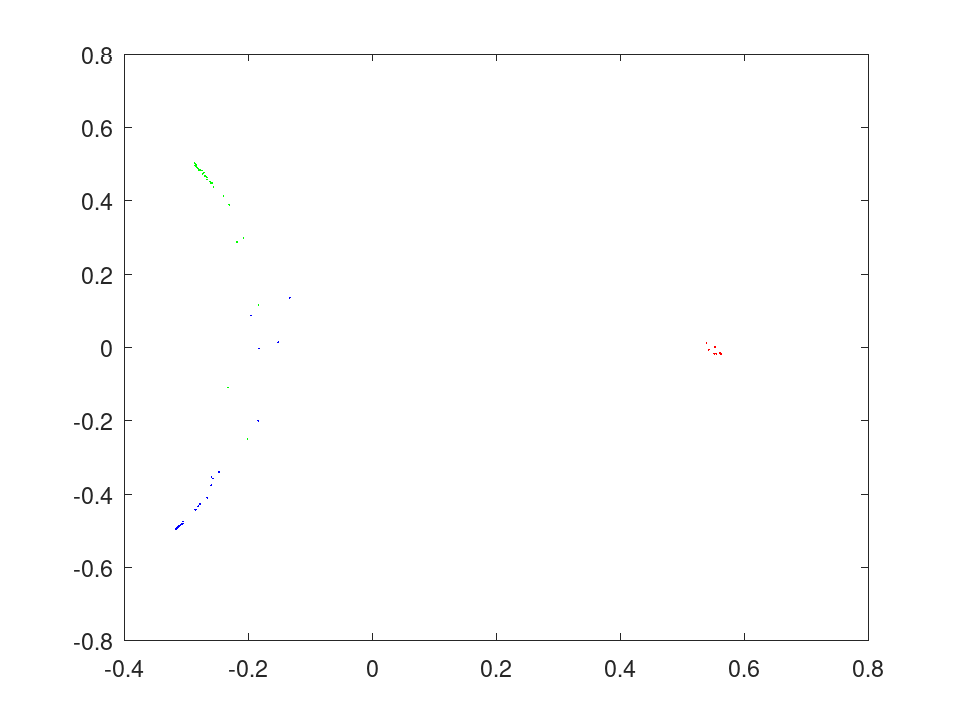
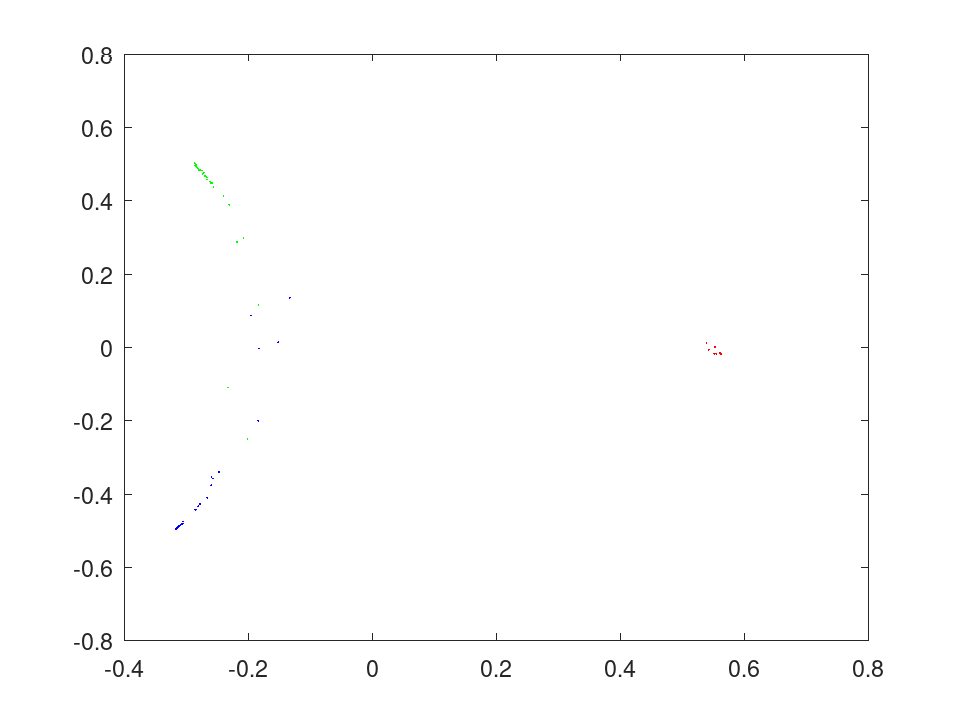
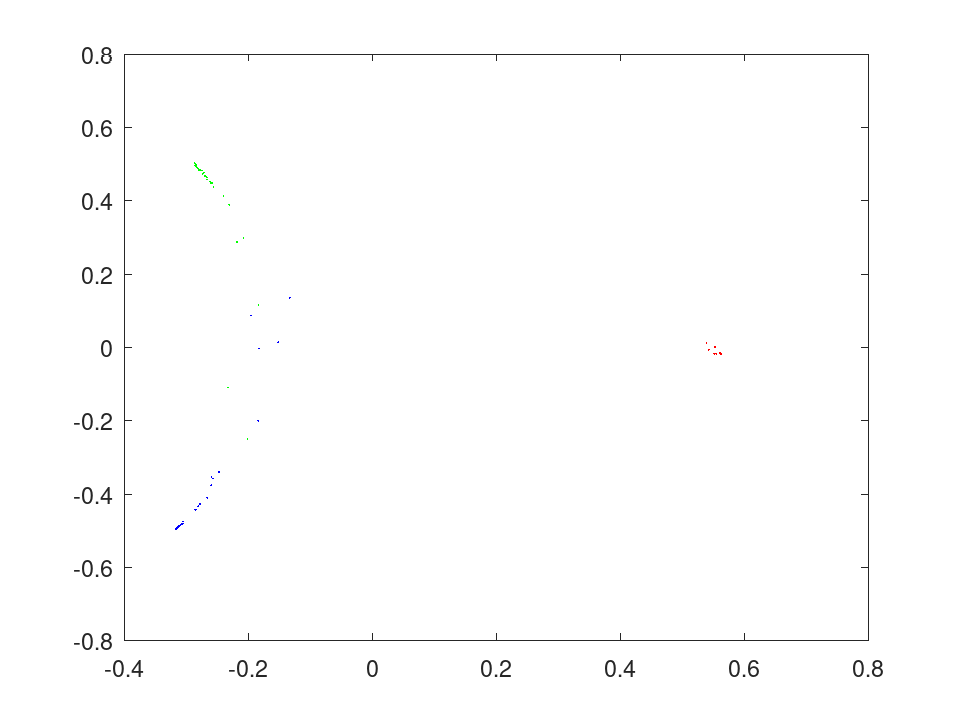
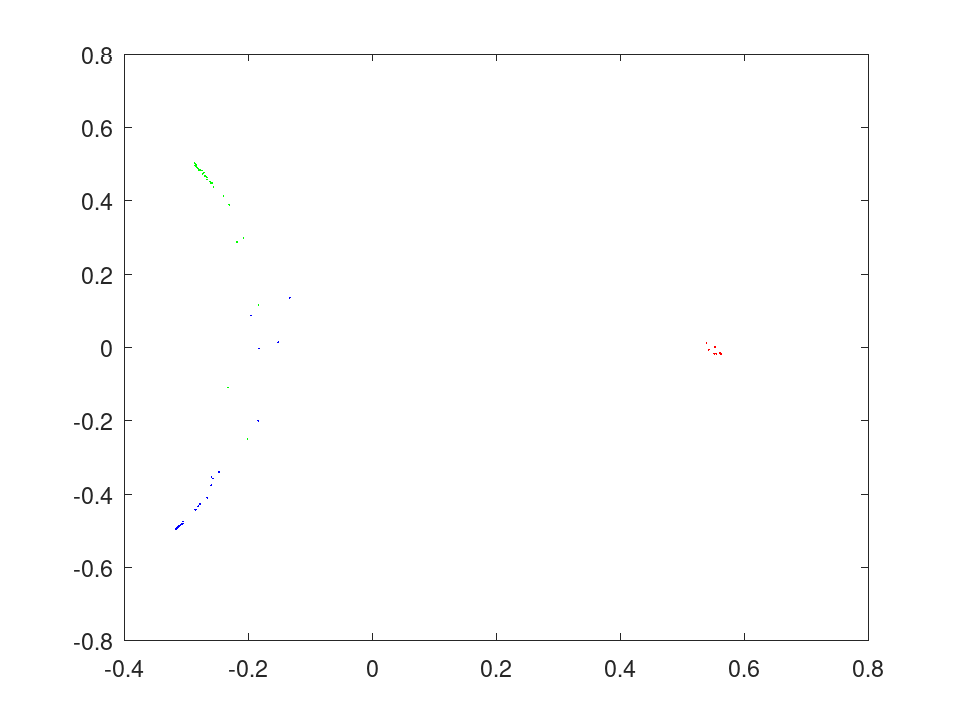
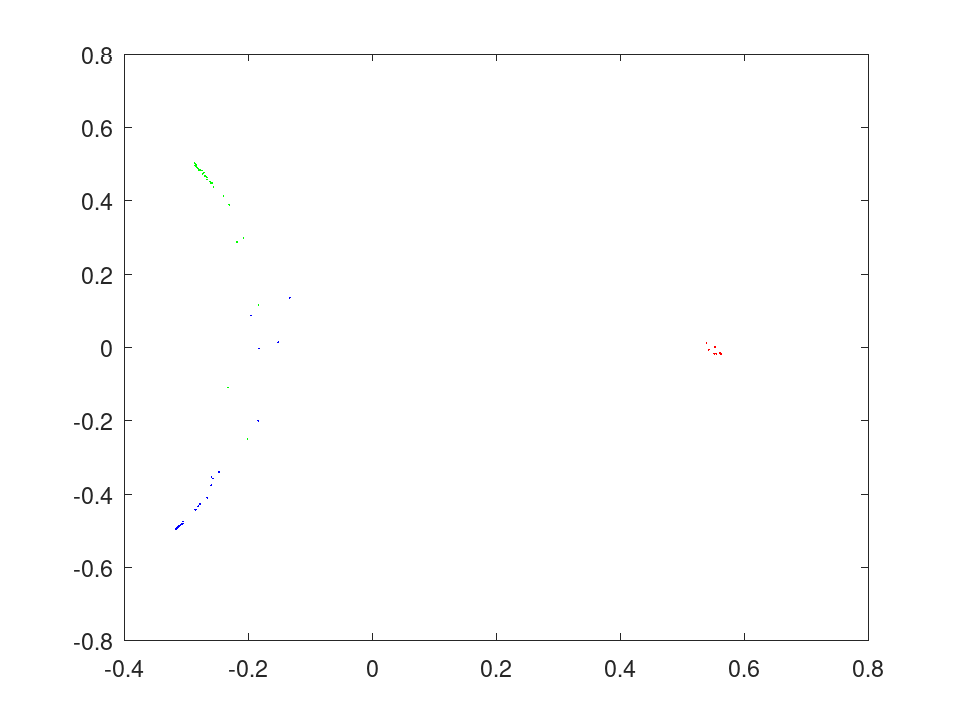
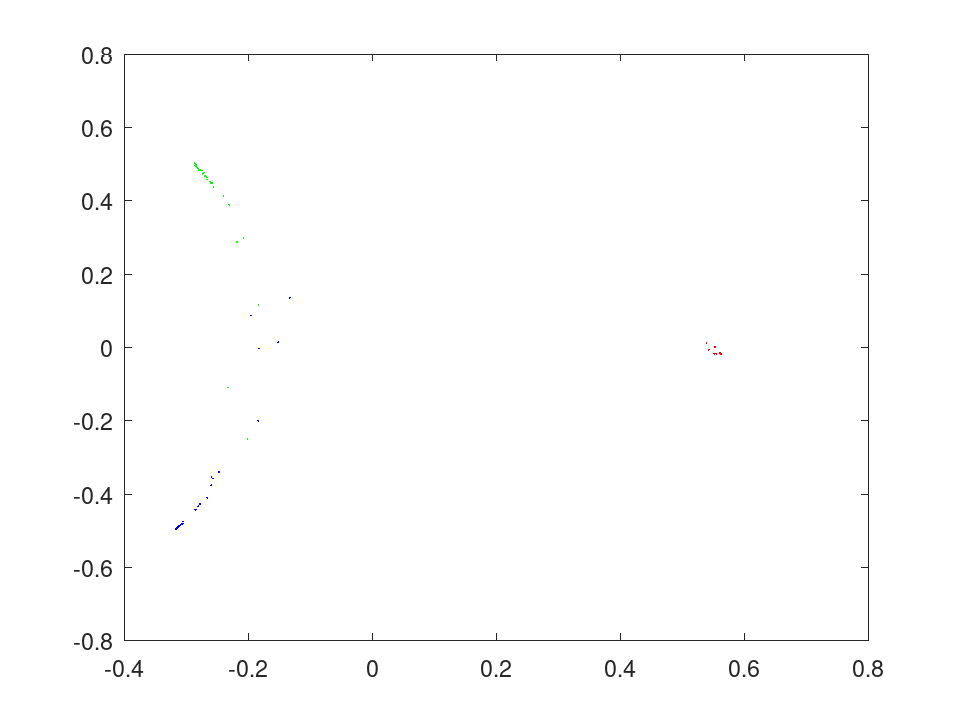
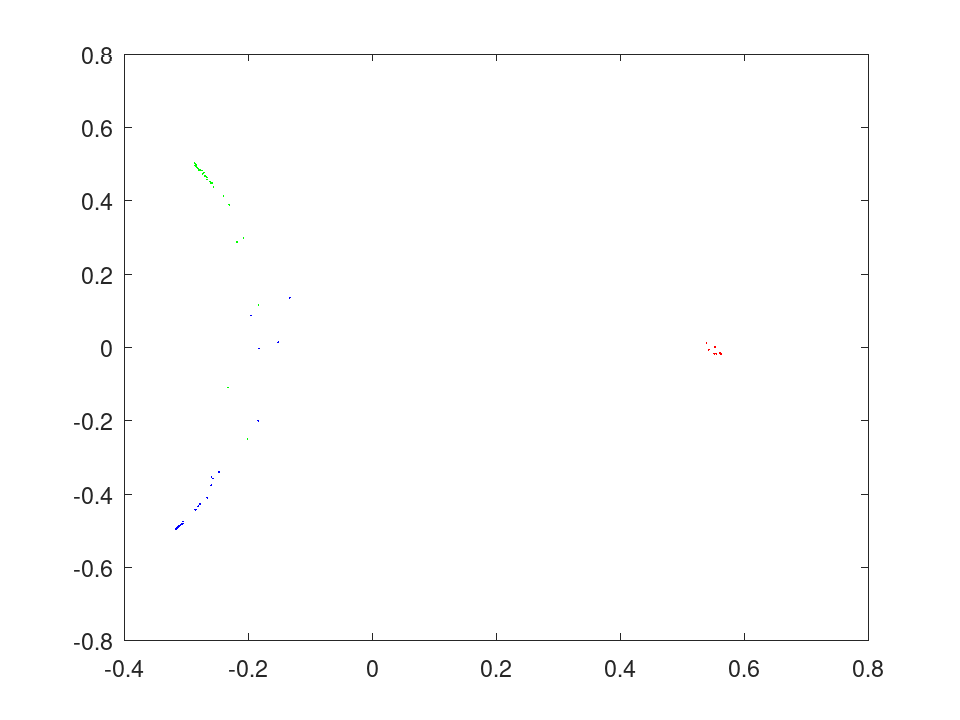
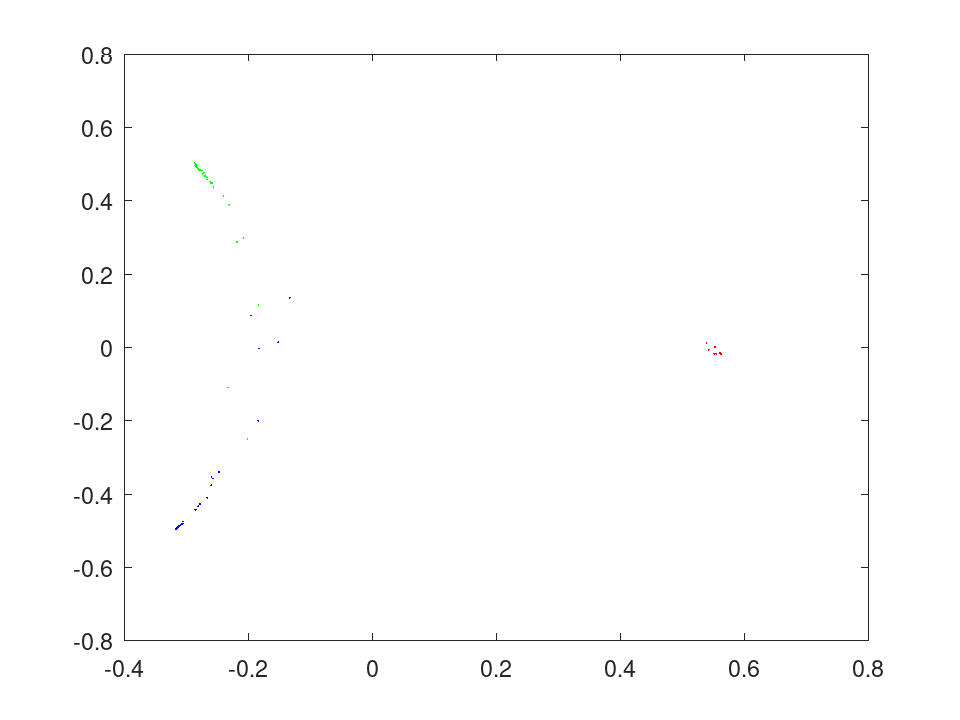
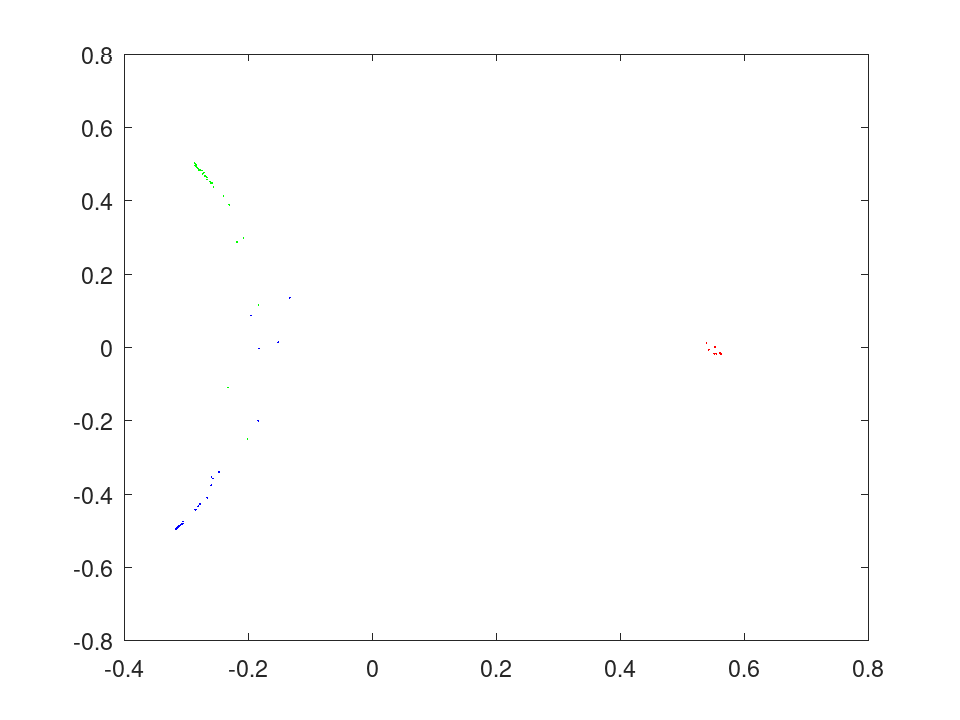
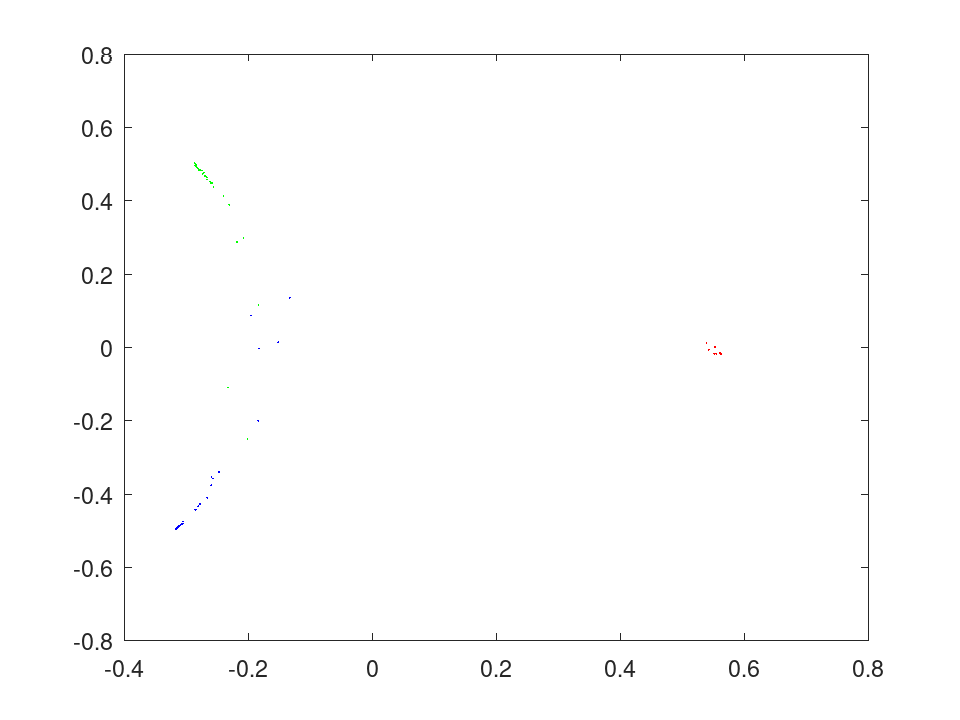
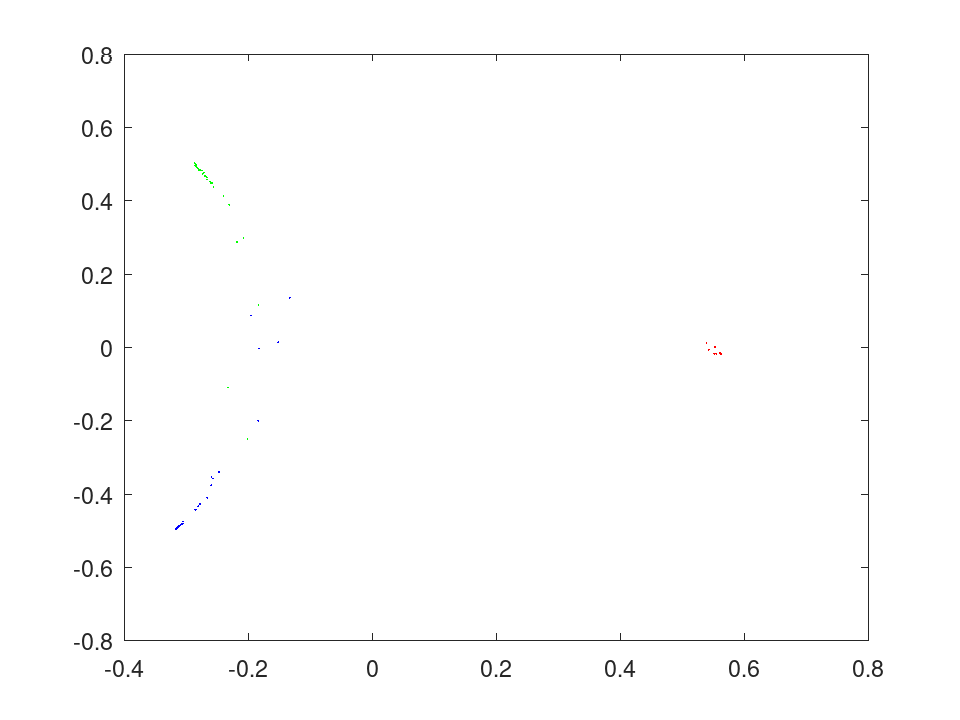
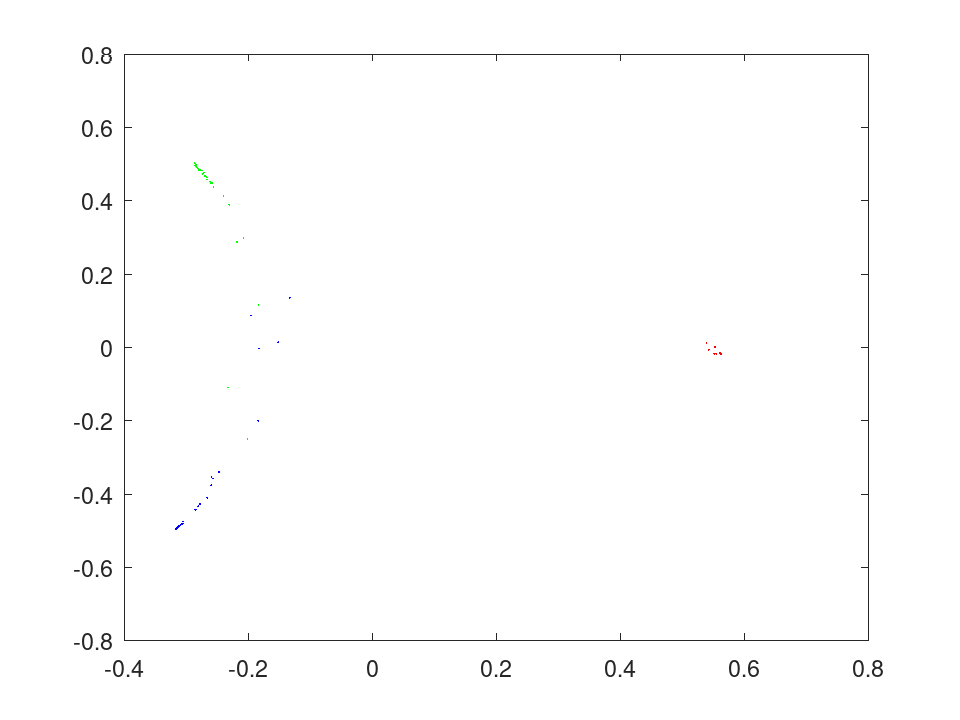
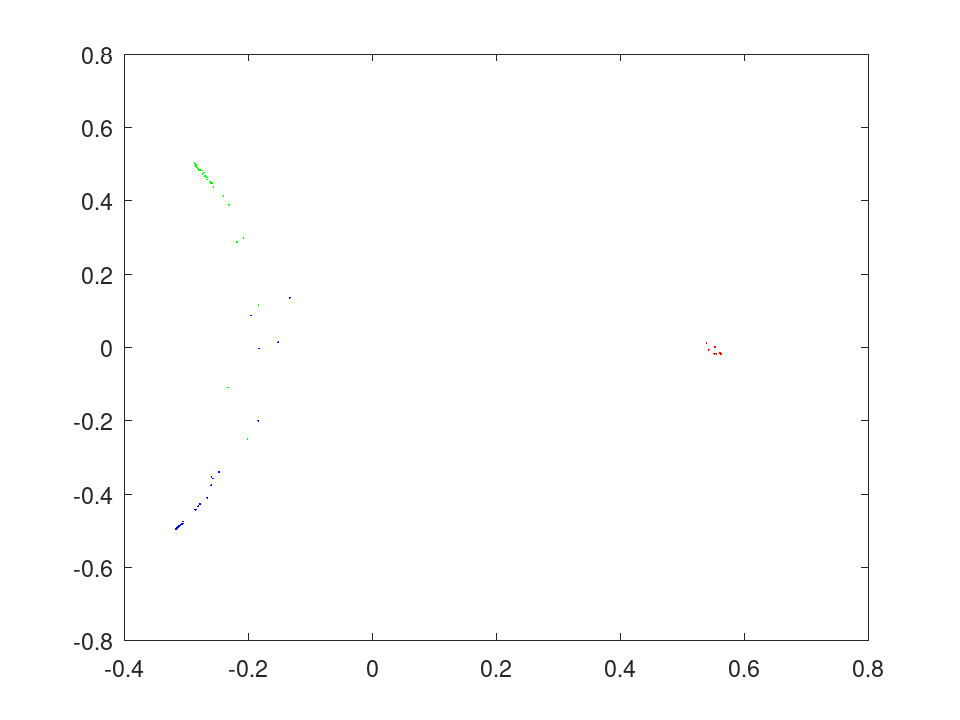
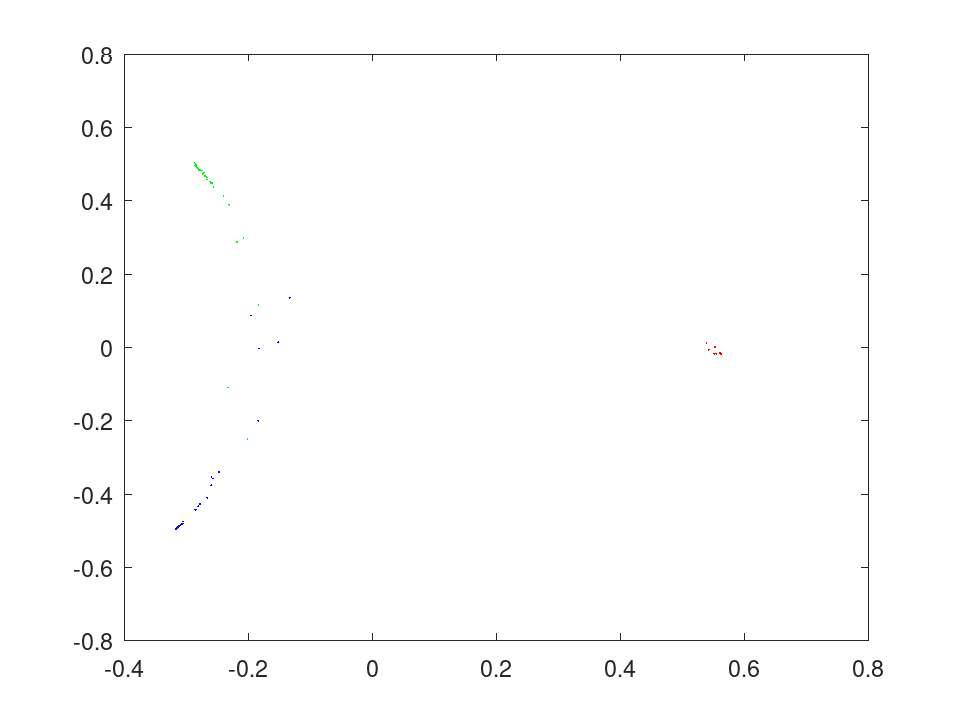
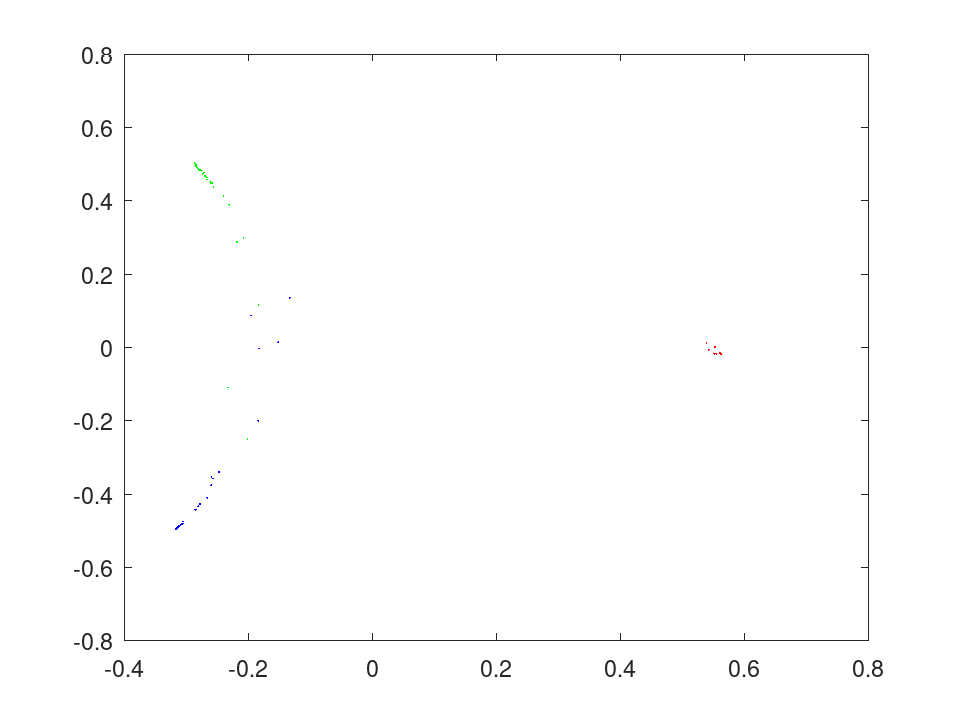
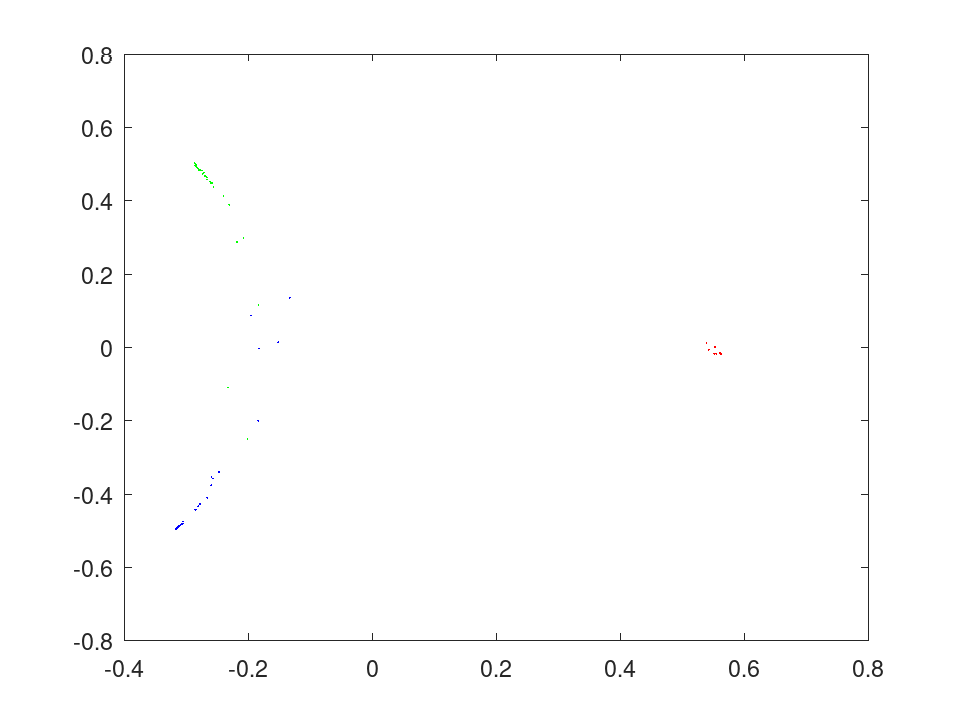
Scale the proximities of a random forest to two dimensions and draw the flowers one color per species.
 load fisheriris
 rng (42);
 B = fillprox (TreeBagger (50, meas, species));
 mdsprox (B, 'Colors', 'rgb');
A positive integer, the number of trees in the ensemble. This property is read-only.
Grow a random forest on the iris data, estimate its error from the observations each tree left out, and classify a new flower.
 load fisheriris
 rng (42);
 B = TreeBagger (50, meas, species, 'OOBPrediction', 'on');
 err = oobError (B);
 err(end)
ans = 0.053333
label = predict (B, [5.8, 2.8, 4.5, 1.4])
label =
  1x1 cell array

    {'versicolor'}
A regression forest predicting sepal length from the other three measurements, with the spread of its trees around each prediction.
 load fisheriris
 rng (42);
 B = TreeBagger (50, meas(:,2:4), meas(:,1), 'Method', 'regression');
 [yfit, sd] = predict (B, meas([1, 51, 101], 2:4))
yfit =

   5.0382
   6.5283
   6.8350

sd =

   0.1101
   0.1816
   0.3976
A 90% prediction interval for sepal length from the other three measurements, read off the quantiles of a regression forest.
 load fisheriris
 rng (42);
 B = TreeBagger (100, meas(:,2:4), meas(:,1), 'Method', 'regression');
 q = quantilePredict (B, meas([1, 51, 101], 2:4), ...
                      'Quantile', [0.05, 0.5, 0.95])
q =

   4.6000   5.0463   5.5000
   5.9000   6.5334   7.0853
   6.2196   6.7508   7.7000
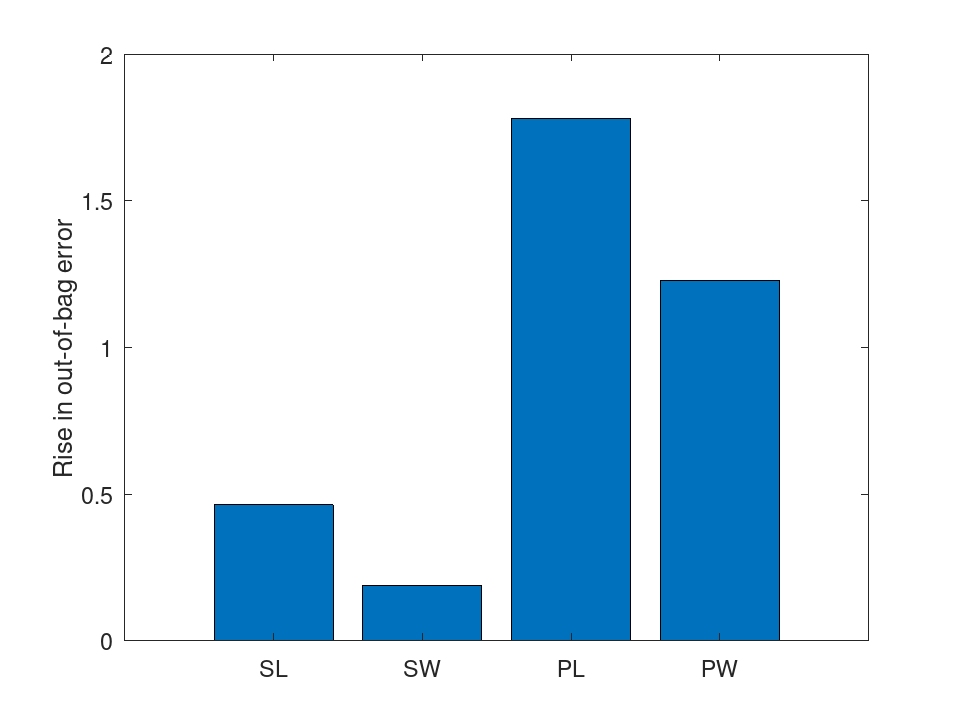
Which measurements a forest relies on: permuting a petal measurement among each tree's out-of-bag flowers raises the error the most.
 load fisheriris
 rng (42);
 B = TreeBagger (50, meas, species, 'OOBPredictorImportance', 'on');
 bar (B.OOBPermutedPredictorDeltaError);
 set (gca, 'xticklabel', {'SL', 'SW', 'PL', 'PW'});
 ylabel ('Rise in out-of-bag error');
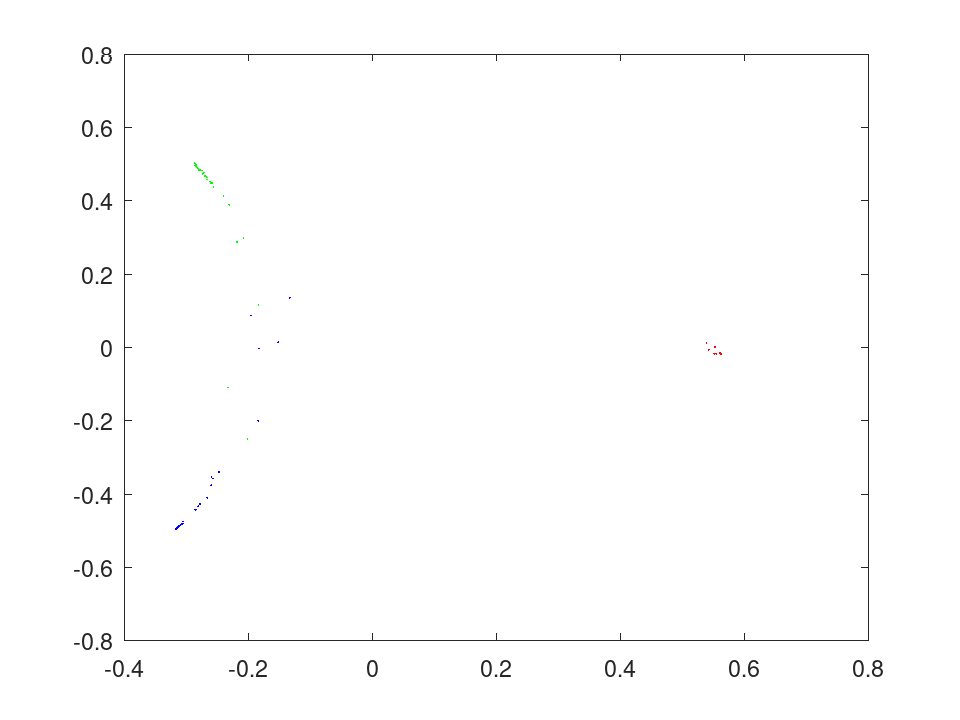
Scale the proximities of a random forest to two dimensions and draw the flowers one color per species.
 load fisheriris
 rng (42);
 B = fillprox (TreeBagger (50, meas, species));
 mdsprox (B, 'Colors', 'rgb');
A column cell array holding one CompactClassificationTree or
CompactRegressionTree object per tree. This property is
read-only.
Grow a random forest on the iris data, estimate its error from the observations each tree left out, and classify a new flower.
 load fisheriris
 rng (42);
 B = TreeBagger (50, meas, species, 'OOBPrediction', 'on');
 err = oobError (B);
 err(end)
ans = 0.053333
label = predict (B, [5.8, 2.8, 4.5, 1.4])
label =
  1x1 cell array

    {'versicolor'}
A regression forest predicting sepal length from the other three measurements, with the spread of its trees around each prediction.
 load fisheriris
 rng (42);
 B = TreeBagger (50, meas(:,2:4), meas(:,1), 'Method', 'regression');
 [yfit, sd] = predict (B, meas([1, 51, 101], 2:4))
yfit =

   5.0382
   6.5283
   6.8350

sd =

   0.1101
   0.1816
   0.3976
A 90% prediction interval for sepal length from the other three measurements, read off the quantiles of a regression forest.
 load fisheriris
 rng (42);
 B = TreeBagger (100, meas(:,2:4), meas(:,1), 'Method', 'regression');
 q = quantilePredict (B, meas([1, 51, 101], 2:4), ...
                      'Quantile', [0.05, 0.5, 0.95])
q =

   4.6000   5.0463   5.5000
   5.9000   6.5334   7.0853
   6.2196   6.7508   7.7000
Which measurements a forest relies on: permuting a petal measurement among each tree's out-of-bag flowers raises the error the most.
 load fisheriris
 rng (42);
 B = TreeBagger (50, meas, species, 'OOBPredictorImportance', 'on');
 bar (B.OOBPermutedPredictorDeltaError);
 set (gca, 'xticklabel', {'SL', 'SW', 'PL', 'PW'});
 ylabel ('Rise in out-of-bag error');
Scale the proximities of a random forest to two dimensions and draw the flowers one color per species.
 load fisheriris
 rng (42);
 B = fillprox (TreeBagger (50, meas, species));
 mdsprox (B, 'Colors', 'rgb');
The predictors the ensemble was fitted on, one row per observation. A row whose response is missing is not kept. This property is read-only.
Where the model was fitted from a table, the predictors are the coded matrix and not the table: a variable holding levels is stored as its level codes, and the coding is kept with the model.
Grow a random forest on the iris data, estimate its error from the observations each tree left out, and classify a new flower.
 load fisheriris
 rng (42);
 B = TreeBagger (50, meas, species, 'OOBPrediction', 'on');
 err = oobError (B);
 err(end)
ans = 0.053333
label = predict (B, [5.8, 2.8, 4.5, 1.4])
label =
  1x1 cell array

    {'versicolor'}
A regression forest predicting sepal length from the other three measurements, with the spread of its trees around each prediction.
 load fisheriris
 rng (42);
 B = TreeBagger (50, meas(:,2:4), meas(:,1), 'Method', 'regression');
 [yfit, sd] = predict (B, meas([1, 51, 101], 2:4))
yfit =

   5.0382
   6.5283
   6.8350

sd =

   0.1101
   0.1816
   0.3976
A 90% prediction interval for sepal length from the other three measurements, read off the quantiles of a regression forest.
 load fisheriris
 rng (42);
 B = TreeBagger (100, meas(:,2:4), meas(:,1), 'Method', 'regression');
 q = quantilePredict (B, meas([1, 51, 101], 2:4), ...
                      'Quantile', [0.05, 0.5, 0.95])
q =

   4.6000   5.0463   5.5000
   5.9000   6.5334   7.0853
   6.2196   6.7508   7.7000
Which measurements a forest relies on: permuting a petal measurement among each tree's out-of-bag flowers raises the error the most.
 load fisheriris
 rng (42);
 B = TreeBagger (50, meas, species, 'OOBPredictorImportance', 'on');
 bar (B.OOBPermutedPredictorDeltaError);
 set (gca, 'xticklabel', {'SL', 'SW', 'PL', 'PW'});
 ylabel ('Rise in out-of-bag error');
Scale the proximities of a random forest to two dimensions and draw the flowers one color per species.
 load fisheriris
 rng (42);
 B = fillprox (TreeBagger (50, meas, species));
 mdsprox (B, 'Colors', 'rgb');
The response the ensemble was fitted on, in the type it was given in, without the observations whose response is missing. This property is read-only.
Grow a random forest on the iris data, estimate its error from the observations each tree left out, and classify a new flower.
 load fisheriris
 rng (42);
 B = TreeBagger (50, meas, species, 'OOBPrediction', 'on');
 err = oobError (B);
 err(end)
ans = 0.053333
label = predict (B, [5.8, 2.8, 4.5, 1.4])
label =
  1x1 cell array

    {'versicolor'}
A regression forest predicting sepal length from the other three measurements, with the spread of its trees around each prediction.
 load fisheriris
 rng (42);
 B = TreeBagger (50, meas(:,2:4), meas(:,1), 'Method', 'regression');
 [yfit, sd] = predict (B, meas([1, 51, 101], 2:4))
yfit =

   5.0382
   6.5283
   6.8350

sd =

   0.1101
   0.1816
   0.3976
A 90% prediction interval for sepal length from the other three measurements, read off the quantiles of a regression forest.
 load fisheriris
 rng (42);
 B = TreeBagger (100, meas(:,2:4), meas(:,1), 'Method', 'regression');
 q = quantilePredict (B, meas([1, 51, 101], 2:4), ...
                      'Quantile', [0.05, 0.5, 0.95])
q =

   4.6000   5.0463   5.5000
   5.9000   6.5334   7.0853
   6.2196   6.7508   7.7000
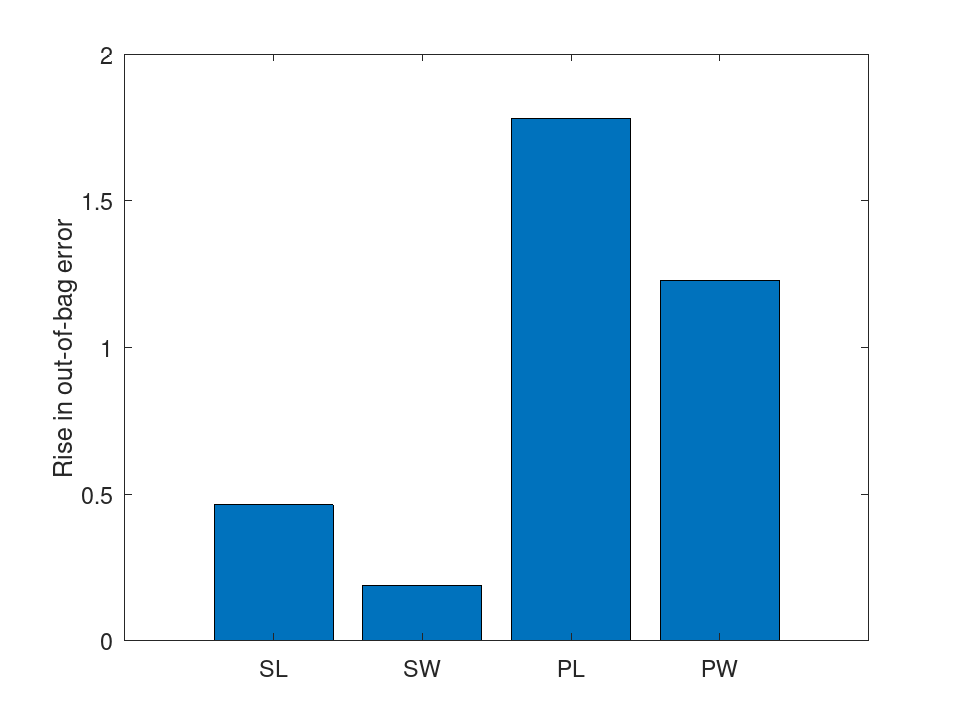
Which measurements a forest relies on: permuting a petal measurement among each tree's out-of-bag flowers raises the error the most.
 load fisheriris
 rng (42);
 B = TreeBagger (50, meas, species, 'OOBPredictorImportance', 'on');
 bar (B.OOBPermutedPredictorDeltaError);
 set (gca, 'xticklabel', {'SL', 'SW', 'PL', 'PW'});
 ylabel ('Rise in out-of-bag error');
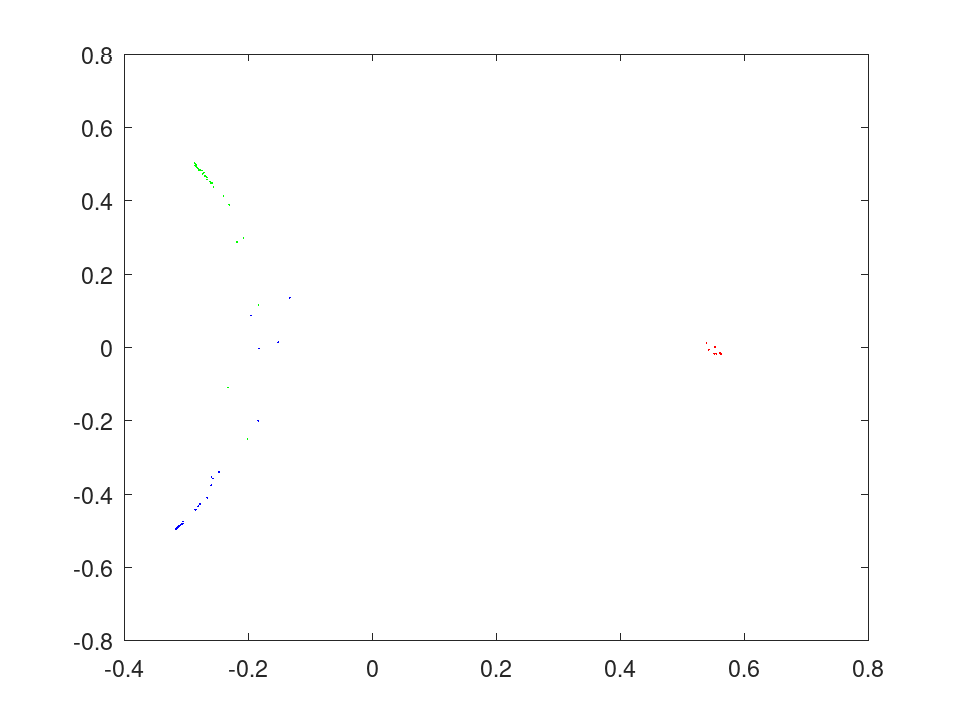
Scale the proximities of a random forest to two dimensions and draw the flowers one color per species.
 load fisheriris
 rng (42);
 B = fillprox (TreeBagger (50, meas, species));
 mdsprox (B, 'Colors', 'rgb');
A column of weights summing to one, one per observation. For
classification each class’s weights sum to its prior. The bootstrap
draws observations in proportion to these weights, and the out-of-bag
error is weighted by them. It has the class of the 'Weights'
given, single or double. This property is read-only.
Grow a random forest on the iris data, estimate its error from the observations each tree left out, and classify a new flower.
 load fisheriris
 rng (42);
 B = TreeBagger (50, meas, species, 'OOBPrediction', 'on');
 err = oobError (B);
 err(end)
ans = 0.053333
label = predict (B, [5.8, 2.8, 4.5, 1.4])
label =
  1x1 cell array

    {'versicolor'}
A regression forest predicting sepal length from the other three measurements, with the spread of its trees around each prediction.
 load fisheriris
 rng (42);
 B = TreeBagger (50, meas(:,2:4), meas(:,1), 'Method', 'regression');
 [yfit, sd] = predict (B, meas([1, 51, 101], 2:4))
yfit =

   5.0382
   6.5283
   6.8350

sd =

   0.1101
   0.1816
   0.3976
A 90% prediction interval for sepal length from the other three measurements, read off the quantiles of a regression forest.
 load fisheriris
 rng (42);
 B = TreeBagger (100, meas(:,2:4), meas(:,1), 'Method', 'regression');
 q = quantilePredict (B, meas([1, 51, 101], 2:4), ...
                      'Quantile', [0.05, 0.5, 0.95])
q =

   4.6000   5.0463   5.5000
   5.9000   6.5334   7.0853
   6.2196   6.7508   7.7000
Which measurements a forest relies on: permuting a petal measurement among each tree's out-of-bag flowers raises the error the most.
 load fisheriris
 rng (42);
 B = TreeBagger (50, meas, species, 'OOBPredictorImportance', 'on');
 bar (B.OOBPermutedPredictorDeltaError);
 set (gca, 'xticklabel', {'SL', 'SW', 'PL', 'PW'});
 ylabel ('Rise in out-of-bag error');
Scale the proximities of a random forest to two dimensions and draw the flowers one color per species.
 load fisheriris
 rng (42);
 B = fillprox (TreeBagger (50, meas, species));
 mdsprox (B, 'Colors', 'rgb');
The classes of a classification ensemble, in the type of the response
and in the order its scores are laid out: sorted, or the order given by
'ClassNames'. Empty for a regression ensemble. This property
is read-only.
Grow a random forest on the iris data, estimate its error from the observations each tree left out, and classify a new flower.
 load fisheriris
 rng (42);
 B = TreeBagger (50, meas, species, 'OOBPrediction', 'on');
 err = oobError (B);
 err(end)
ans = 0.053333
label = predict (B, [5.8, 2.8, 4.5, 1.4])
label =
  1x1 cell array

    {'versicolor'}
A regression forest predicting sepal length from the other three measurements, with the spread of its trees around each prediction.
 load fisheriris
 rng (42);
 B = TreeBagger (50, meas(:,2:4), meas(:,1), 'Method', 'regression');
 [yfit, sd] = predict (B, meas([1, 51, 101], 2:4))
yfit =

   5.0382
   6.5283
   6.8350

sd =

   0.1101
   0.1816
   0.3976
A 90% prediction interval for sepal length from the other three measurements, read off the quantiles of a regression forest.
 load fisheriris
 rng (42);
 B = TreeBagger (100, meas(:,2:4), meas(:,1), 'Method', 'regression');
 q = quantilePredict (B, meas([1, 51, 101], 2:4), ...
                      'Quantile', [0.05, 0.5, 0.95])
q =

   4.6000   5.0463   5.5000
   5.9000   6.5334   7.0853
   6.2196   6.7508   7.7000
Which measurements a forest relies on: permuting a petal measurement among each tree's out-of-bag flowers raises the error the most.
 load fisheriris
 rng (42);
 B = TreeBagger (50, meas, species, 'OOBPredictorImportance', 'on');
 bar (B.OOBPermutedPredictorDeltaError);
 set (gca, 'xticklabel', {'SL', 'SW', 'PL', 'PW'});
 ylabel ('Rise in out-of-bag error');
Scale the proximities of a random forest to two dimensions and draw the flowers one color per species.
 load fisheriris
 rng (42);
 B = fillprox (TreeBagger (50, meas, species));
 mdsprox (B, 'Colors', 'rgb');
A row vector with one probability per class, in the order of
ClassNames. Every tree is grown with this prior, restricted to
the classes its sample holds. Empty for a regression ensemble. This
property is read-only.
Grow a random forest on the iris data, estimate its error from the observations each tree left out, and classify a new flower.
 load fisheriris
 rng (42);
 B = TreeBagger (50, meas, species, 'OOBPrediction', 'on');
 err = oobError (B);
 err(end)
ans = 0.053333
label = predict (B, [5.8, 2.8, 4.5, 1.4])
label =
  1x1 cell array

    {'versicolor'}
A regression forest predicting sepal length from the other three measurements, with the spread of its trees around each prediction.
 load fisheriris
 rng (42);
 B = TreeBagger (50, meas(:,2:4), meas(:,1), 'Method', 'regression');
 [yfit, sd] = predict (B, meas([1, 51, 101], 2:4))
yfit =

   5.0382
   6.5283
   6.8350

sd =

   0.1101
   0.1816
   0.3976
A 90% prediction interval for sepal length from the other three measurements, read off the quantiles of a regression forest.
 load fisheriris
 rng (42);
 B = TreeBagger (100, meas(:,2:4), meas(:,1), 'Method', 'regression');
 q = quantilePredict (B, meas([1, 51, 101], 2:4), ...
                      'Quantile', [0.05, 0.5, 0.95])
q =

   4.6000   5.0463   5.5000
   5.9000   6.5334   7.0853
   6.2196   6.7508   7.7000
Which measurements a forest relies on: permuting a petal measurement among each tree's out-of-bag flowers raises the error the most.
 load fisheriris
 rng (42);
 B = TreeBagger (50, meas, species, 'OOBPredictorImportance', 'on');
 bar (B.OOBPermutedPredictorDeltaError);
 set (gca, 'xticklabel', {'SL', 'SW', 'PL', 'PW'});
 ylabel ('Rise in out-of-bag error');
Scale the proximities of a random forest to two dimensions and draw the flowers one color per species.
 load fisheriris
 rng (42);
 B = fillprox (TreeBagger (50, meas, species));
 mdsprox (B, 'Colors', 'rgb');
A square matrix, Cost(i,j) being the cost of classifying an
observation of class i as class j. The trees are grown
with it; the ensemble’s label is the class of highest average score, as
MATLAB documents. Empty for a regression ensemble. This property is
read-only.
Grow a random forest on the iris data, estimate its error from the observations each tree left out, and classify a new flower.
 load fisheriris
 rng (42);
 B = TreeBagger (50, meas, species, 'OOBPrediction', 'on');
 err = oobError (B);
 err(end)
ans = 0.053333
label = predict (B, [5.8, 2.8, 4.5, 1.4])
label =
  1x1 cell array

    {'versicolor'}
A regression forest predicting sepal length from the other three measurements, with the spread of its trees around each prediction.
 load fisheriris
 rng (42);
 B = TreeBagger (50, meas(:,2:4), meas(:,1), 'Method', 'regression');
 [yfit, sd] = predict (B, meas([1, 51, 101], 2:4))
yfit =

   5.0382
   6.5283
   6.8350

sd =

   0.1101
   0.1816
   0.3976
A 90% prediction interval for sepal length from the other three measurements, read off the quantiles of a regression forest.
 load fisheriris
 rng (42);
 B = TreeBagger (100, meas(:,2:4), meas(:,1), 'Method', 'regression');
 q = quantilePredict (B, meas([1, 51, 101], 2:4), ...
                      'Quantile', [0.05, 0.5, 0.95])
q =

   4.6000   5.0463   5.5000
   5.9000   6.5334   7.0853
   6.2196   6.7508   7.7000
Which measurements a forest relies on: permuting a petal measurement among each tree's out-of-bag flowers raises the error the most.
 load fisheriris
 rng (42);
 B = TreeBagger (50, meas, species, 'OOBPredictorImportance', 'on');
 bar (B.OOBPermutedPredictorDeltaError);
 set (gca, 'xticklabel', {'SL', 'SW', 'PL', 'PW'});
 ylabel ('Rise in out-of-bag error');
Scale the proximities of a random forest to two dimensions and draw the flowers one color per species.
 load fisheriris
 rng (42);
 B = fillprox (TreeBagger (50, meas, species));
 mdsprox (B, 'Colors', 'rgb');
For classification, the class of greatest prior probability, in the
type of ClassNames; for regression, the weighted mean of the
response. An out-of-bag prediction takes it for an observation that is
in the sample of every tree. This property is read-only.
Grow a random forest on the iris data, estimate its error from the observations each tree left out, and classify a new flower.
 load fisheriris
 rng (42);
 B = TreeBagger (50, meas, species, 'OOBPrediction', 'on');
 err = oobError (B);
 err(end)
ans = 0.053333
label = predict (B, [5.8, 2.8, 4.5, 1.4])
label =
  1x1 cell array

    {'versicolor'}
A regression forest predicting sepal length from the other three measurements, with the spread of its trees around each prediction.
 load fisheriris
 rng (42);
 B = TreeBagger (50, meas(:,2:4), meas(:,1), 'Method', 'regression');
 [yfit, sd] = predict (B, meas([1, 51, 101], 2:4))
yfit =

   5.0382
   6.5283
   6.8350

sd =

   0.1101
   0.1816
   0.3976
A 90% prediction interval for sepal length from the other three measurements, read off the quantiles of a regression forest.
 load fisheriris
 rng (42);
 B = TreeBagger (100, meas(:,2:4), meas(:,1), 'Method', 'regression');
 q = quantilePredict (B, meas([1, 51, 101], 2:4), ...
                      'Quantile', [0.05, 0.5, 0.95])
q =

   4.6000   5.0463   5.5000
   5.9000   6.5334   7.0853
   6.2196   6.7508   7.7000
Which measurements a forest relies on: permuting a petal measurement among each tree's out-of-bag flowers raises the error the most.
 load fisheriris
 rng (42);
 B = TreeBagger (50, meas, species, 'OOBPredictorImportance', 'on');
 bar (B.OOBPermutedPredictorDeltaError);
 set (gca, 'xticklabel', {'SL', 'SW', 'PL', 'PW'});
 ylabel ('Rise in out-of-bag error');
Scale the proximities of a random forest to two dimensions and draw the flowers one color per species.
 load fisheriris
 rng (42);
 B = fillprox (TreeBagger (50, meas, species));
 mdsprox (B, 'Colors', 'rgb');
A cell array of character vectors naming the columns of X. This
property is read-only.
Grow a random forest on the iris data, estimate its error from the observations each tree left out, and classify a new flower.
 load fisheriris
 rng (42);
 B = TreeBagger (50, meas, species, 'OOBPrediction', 'on');
 err = oobError (B);
 err(end)
ans = 0.053333
label = predict (B, [5.8, 2.8, 4.5, 1.4])
label =
  1x1 cell array

    {'versicolor'}
A regression forest predicting sepal length from the other three measurements, with the spread of its trees around each prediction.
 load fisheriris
 rng (42);
 B = TreeBagger (50, meas(:,2:4), meas(:,1), 'Method', 'regression');
 [yfit, sd] = predict (B, meas([1, 51, 101], 2:4))
yfit =

   5.0382
   6.5283
   6.8350

sd =

   0.1101
   0.1816
   0.3976
A 90% prediction interval for sepal length from the other three measurements, read off the quantiles of a regression forest.
 load fisheriris
 rng (42);
 B = TreeBagger (100, meas(:,2:4), meas(:,1), 'Method', 'regression');
 q = quantilePredict (B, meas([1, 51, 101], 2:4), ...
                      'Quantile', [0.05, 0.5, 0.95])
q =

   4.6000   5.0463   5.5000
   5.9000   6.5334   7.0853
   6.2196   6.7508   7.7000
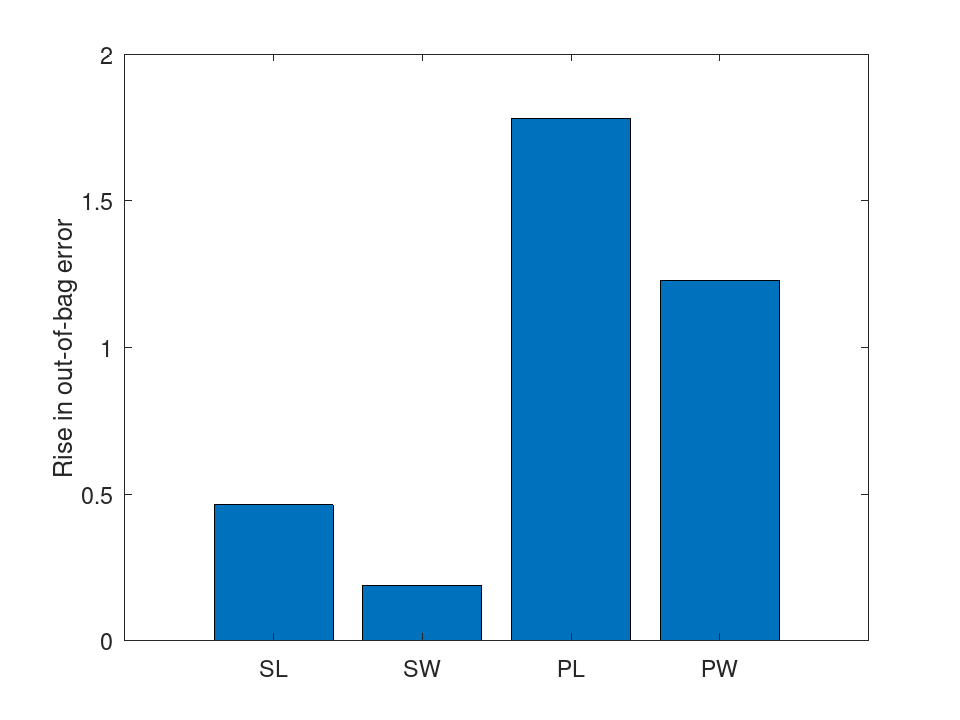
Which measurements a forest relies on: permuting a petal measurement among each tree's out-of-bag flowers raises the error the most.
 load fisheriris
 rng (42);
 B = TreeBagger (50, meas, species, 'OOBPredictorImportance', 'on');
 bar (B.OOBPermutedPredictorDeltaError);
 set (gca, 'xticklabel', {'SL', 'SW', 'PL', 'PW'});
 ylabel ('Rise in out-of-bag error');
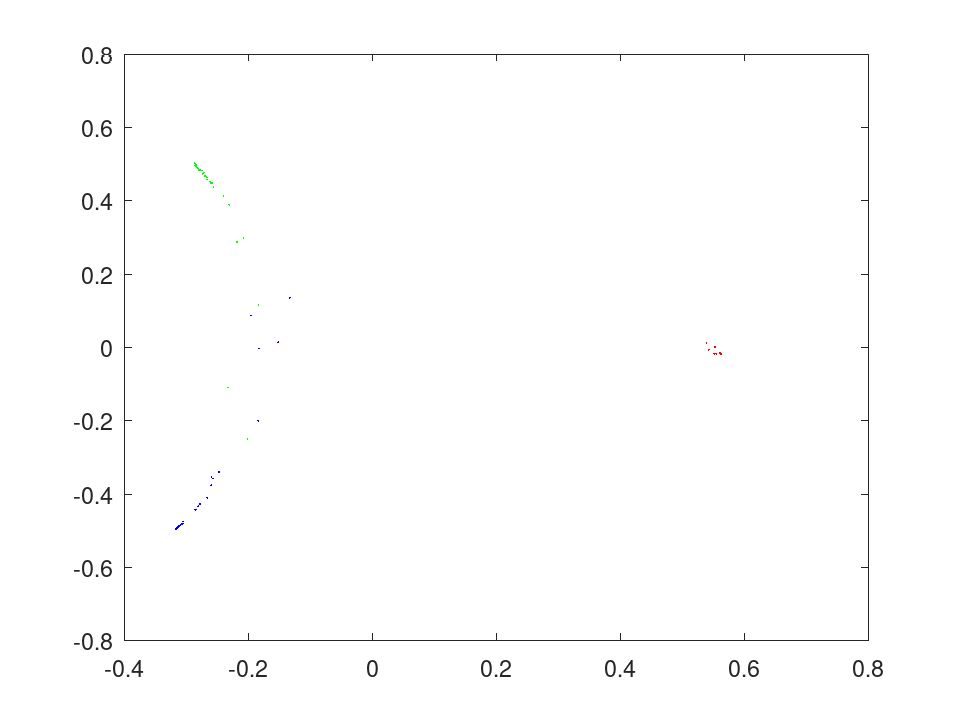
Scale the proximities of a random forest to two dimensions and draw the flowers one color per species.
 load fisheriris
 rng (42);
 B = fillprox (TreeBagger (50, meas, species));
 mdsprox (B, 'Colors', 'rgb');
A row vector of column indices into X, naming the predictors treated as categorical, empty when none is. This property is read-only.
Grow a random forest on the iris data, estimate its error from the observations each tree left out, and classify a new flower.
 load fisheriris
 rng (42);
 B = TreeBagger (50, meas, species, 'OOBPrediction', 'on');
 err = oobError (B);
 err(end)
ans = 0.053333
label = predict (B, [5.8, 2.8, 4.5, 1.4])
label =
  1x1 cell array

    {'versicolor'}
A regression forest predicting sepal length from the other three measurements, with the spread of its trees around each prediction.
 load fisheriris
 rng (42);
 B = TreeBagger (50, meas(:,2:4), meas(:,1), 'Method', 'regression');
 [yfit, sd] = predict (B, meas([1, 51, 101], 2:4))
yfit =

   5.0382
   6.5283
   6.8350

sd =

   0.1101
   0.1816
   0.3976
A 90% prediction interval for sepal length from the other three measurements, read off the quantiles of a regression forest.
 load fisheriris
 rng (42);
 B = TreeBagger (100, meas(:,2:4), meas(:,1), 'Method', 'regression');
 q = quantilePredict (B, meas([1, 51, 101], 2:4), ...
                      'Quantile', [0.05, 0.5, 0.95])
q =

   4.6000   5.0463   5.5000
   5.9000   6.5334   7.0853
   6.2196   6.7508   7.7000
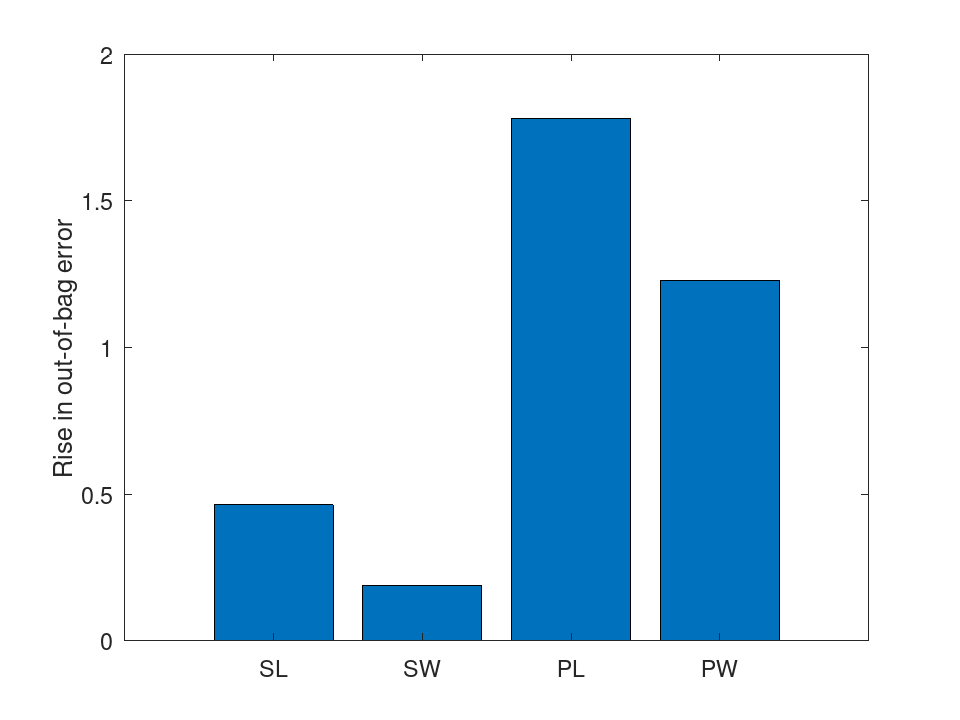
Which measurements a forest relies on: permuting a petal measurement among each tree's out-of-bag flowers raises the error the most.
 load fisheriris
 rng (42);
 B = TreeBagger (50, meas, species, 'OOBPredictorImportance', 'on');
 bar (B.OOBPermutedPredictorDeltaError);
 set (gca, 'xticklabel', {'SL', 'SW', 'PL', 'PW'});
 ylabel ('Rise in out-of-bag error');
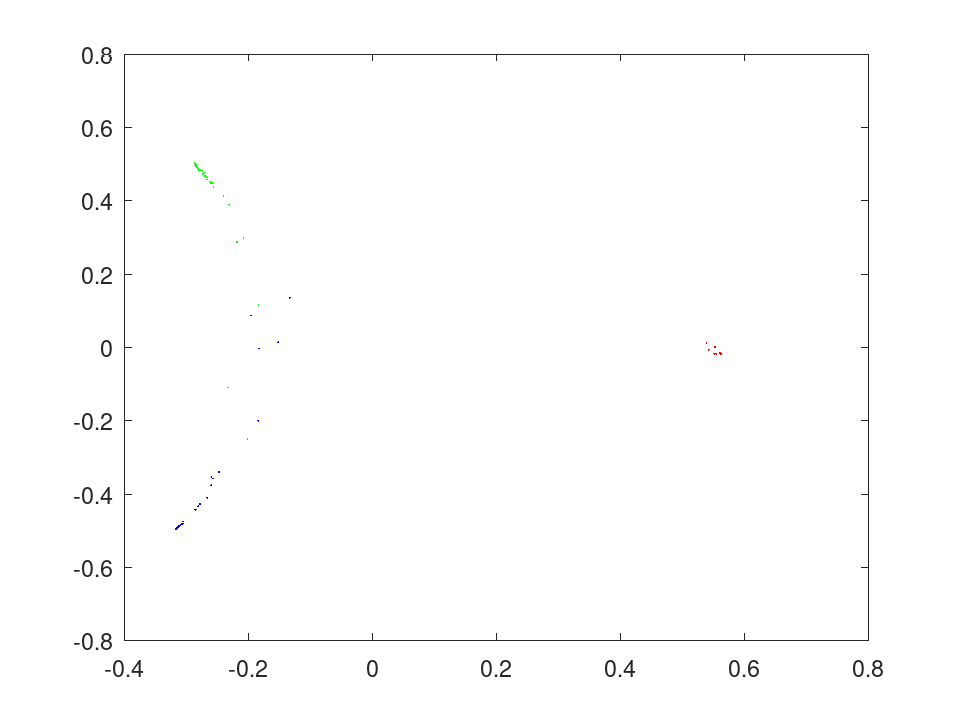
Scale the proximities of a random forest to two dimensions and draw the flowers one color per species.
 load fisheriris
 rng (42);
 B = fillprox (TreeBagger (50, meas, species));
 mdsprox (B, 'Colors', 'rgb');
A positive integer, or 'all'. The default is the square root
of the number of predictors for classification and a third of it for
regression, rounded up. This property is read-only.
Grow a random forest on the iris data, estimate its error from the observations each tree left out, and classify a new flower.
 load fisheriris
 rng (42);
 B = TreeBagger (50, meas, species, 'OOBPrediction', 'on');
 err = oobError (B);
 err(end)
ans = 0.053333
label = predict (B, [5.8, 2.8, 4.5, 1.4])
label =
  1x1 cell array

    {'versicolor'}
A regression forest predicting sepal length from the other three measurements, with the spread of its trees around each prediction.
 load fisheriris
 rng (42);
 B = TreeBagger (50, meas(:,2:4), meas(:,1), 'Method', 'regression');
 [yfit, sd] = predict (B, meas([1, 51, 101], 2:4))
yfit =

   5.0382
   6.5283
   6.8350

sd =

   0.1101
   0.1816
   0.3976
A 90% prediction interval for sepal length from the other three measurements, read off the quantiles of a regression forest.
 load fisheriris
 rng (42);
 B = TreeBagger (100, meas(:,2:4), meas(:,1), 'Method', 'regression');
 q = quantilePredict (B, meas([1, 51, 101], 2:4), ...
                      'Quantile', [0.05, 0.5, 0.95])
q =

   4.6000   5.0463   5.5000
   5.9000   6.5334   7.0853
   6.2196   6.7508   7.7000
Which measurements a forest relies on: permuting a petal measurement among each tree's out-of-bag flowers raises the error the most.
 load fisheriris
 rng (42);
 B = TreeBagger (50, meas, species, 'OOBPredictorImportance', 'on');
 bar (B.OOBPermutedPredictorDeltaError);
 set (gca, 'xticklabel', {'SL', 'SW', 'PL', 'PW'});
 ylabel ('Rise in out-of-bag error');
Scale the proximities of a random forest to two dimensions and draw the flowers one color per species.
 load fisheriris
 rng (42);
 B = fillprox (TreeBagger (50, meas, species));
 mdsprox (B, 'Colors', 'rgb');
A positive integer, 1 by default for classification and 5 for regression. A node is split only when it holds at least twice as many. This property is read-only.
Grow a random forest on the iris data, estimate its error from the observations each tree left out, and classify a new flower.
 load fisheriris
 rng (42);
 B = TreeBagger (50, meas, species, 'OOBPrediction', 'on');
 err = oobError (B);
 err(end)
ans = 0.053333
label = predict (B, [5.8, 2.8, 4.5, 1.4])
label =
  1x1 cell array

    {'versicolor'}
A regression forest predicting sepal length from the other three measurements, with the spread of its trees around each prediction.
 load fisheriris
 rng (42);
 B = TreeBagger (50, meas(:,2:4), meas(:,1), 'Method', 'regression');
 [yfit, sd] = predict (B, meas([1, 51, 101], 2:4))
yfit =

   5.0382
   6.5283
   6.8350

sd =

   0.1101
   0.1816
   0.3976
A 90% prediction interval for sepal length from the other three measurements, read off the quantiles of a regression forest.
 load fisheriris
 rng (42);
 B = TreeBagger (100, meas(:,2:4), meas(:,1), 'Method', 'regression');
 q = quantilePredict (B, meas([1, 51, 101], 2:4), ...
                      'Quantile', [0.05, 0.5, 0.95])
q =

   4.6000   5.0463   5.5000
   5.9000   6.5334   7.0853
   6.2196   6.7508   7.7000
Which measurements a forest relies on: permuting a petal measurement among each tree's out-of-bag flowers raises the error the most.
 load fisheriris
 rng (42);
 B = TreeBagger (50, meas, species, 'OOBPredictorImportance', 'on');
 bar (B.OOBPermutedPredictorDeltaError);
 set (gca, 'xticklabel', {'SL', 'SW', 'PL', 'PW'});
 ylabel ('Rise in out-of-bag error');
Scale the proximities of a random forest to two dimensions and draw the flowers one color per species.
 load fisheriris
 rng (42);
 B = fillprox (TreeBagger (50, meas, species));
 mdsprox (B, 'Colors', 'rgb');
A number greater than 0 and no greater than 1. Each tree is grown on
ceil (InBagFraction * N) observations. This property is
read-only.
Grow a random forest on the iris data, estimate its error from the observations each tree left out, and classify a new flower.
 load fisheriris
 rng (42);
 B = TreeBagger (50, meas, species, 'OOBPrediction', 'on');
 err = oobError (B);
 err(end)
ans = 0.053333
label = predict (B, [5.8, 2.8, 4.5, 1.4])
label =
  1x1 cell array

    {'versicolor'}
A regression forest predicting sepal length from the other three measurements, with the spread of its trees around each prediction.
 load fisheriris
 rng (42);
 B = TreeBagger (50, meas(:,2:4), meas(:,1), 'Method', 'regression');
 [yfit, sd] = predict (B, meas([1, 51, 101], 2:4))
yfit =

   5.0382
   6.5283
   6.8350

sd =

   0.1101
   0.1816
   0.3976
A 90% prediction interval for sepal length from the other three measurements, read off the quantiles of a regression forest.
 load fisheriris
 rng (42);
 B = TreeBagger (100, meas(:,2:4), meas(:,1), 'Method', 'regression');
 q = quantilePredict (B, meas([1, 51, 101], 2:4), ...
                      'Quantile', [0.05, 0.5, 0.95])
q =

   4.6000   5.0463   5.5000
   5.9000   6.5334   7.0853
   6.2196   6.7508   7.7000
Which measurements a forest relies on: permuting a petal measurement among each tree's out-of-bag flowers raises the error the most.
 load fisheriris
 rng (42);
 B = TreeBagger (50, meas, species, 'OOBPredictorImportance', 'on');
 bar (B.OOBPermutedPredictorDeltaError);
 set (gca, 'xticklabel', {'SL', 'SW', 'PL', 'PW'});
 ylabel ('Rise in out-of-bag error');
Scale the proximities of a random forest to two dimensions and draw the flowers one color per species.
 load fisheriris
 rng (42);
 B = fillprox (TreeBagger (50, meas, species));
 mdsprox (B, 'Colors', 'rgb');
A logical scalar, true by default. This property is read-only.
Grow a random forest on the iris data, estimate its error from the observations each tree left out, and classify a new flower.
 load fisheriris
 rng (42);
 B = TreeBagger (50, meas, species, 'OOBPrediction', 'on');
 err = oobError (B);
 err(end)
ans = 0.053333
label = predict (B, [5.8, 2.8, 4.5, 1.4])
label =
  1x1 cell array

    {'versicolor'}
A regression forest predicting sepal length from the other three measurements, with the spread of its trees around each prediction.
 load fisheriris
 rng (42);
 B = TreeBagger (50, meas(:,2:4), meas(:,1), 'Method', 'regression');
 [yfit, sd] = predict (B, meas([1, 51, 101], 2:4))
yfit =

   5.0382
   6.5283
   6.8350

sd =

   0.1101
   0.1816
   0.3976
A 90% prediction interval for sepal length from the other three measurements, read off the quantiles of a regression forest.
 load fisheriris
 rng (42);
 B = TreeBagger (100, meas(:,2:4), meas(:,1), 'Method', 'regression');
 q = quantilePredict (B, meas([1, 51, 101], 2:4), ...
                      'Quantile', [0.05, 0.5, 0.95])
q =

   4.6000   5.0463   5.5000
   5.9000   6.5334   7.0853
   6.2196   6.7508   7.7000
Which measurements a forest relies on: permuting a petal measurement among each tree's out-of-bag flowers raises the error the most.
 load fisheriris
 rng (42);
 B = TreeBagger (50, meas, species, 'OOBPredictorImportance', 'on');
 bar (B.OOBPermutedPredictorDeltaError);
 set (gca, 'xticklabel', {'SL', 'SW', 'PL', 'PW'});
 ylabel ('Rise in out-of-bag error');
Scale the proximities of a random forest to two dimensions and draw the flowers one color per species.
 load fisheriris
 rng (42);
 B = fillprox (TreeBagger (50, meas, species));
 mdsprox (B, 'Colors', 'rgb');
A logical scalar, false unless the ensemble was fitted with
'OOBPrediction' set to 'on'. The out-of-bag methods
need it. This property is read-only.
Grow a random forest on the iris data, estimate its error from the observations each tree left out, and classify a new flower.
 load fisheriris
 rng (42);
 B = TreeBagger (50, meas, species, 'OOBPrediction', 'on');
 err = oobError (B);
 err(end)
ans = 0.053333
label = predict (B, [5.8, 2.8, 4.5, 1.4])
label =
  1x1 cell array

    {'versicolor'}
A regression forest predicting sepal length from the other three measurements, with the spread of its trees around each prediction.
 load fisheriris
 rng (42);
 B = TreeBagger (50, meas(:,2:4), meas(:,1), 'Method', 'regression');
 [yfit, sd] = predict (B, meas([1, 51, 101], 2:4))
yfit =

   5.0382
   6.5283
   6.8350

sd =

   0.1101
   0.1816
   0.3976
A 90% prediction interval for sepal length from the other three measurements, read off the quantiles of a regression forest.
 load fisheriris
 rng (42);
 B = TreeBagger (100, meas(:,2:4), meas(:,1), 'Method', 'regression');
 q = quantilePredict (B, meas([1, 51, 101], 2:4), ...
                      'Quantile', [0.05, 0.5, 0.95])
q =

   4.6000   5.0463   5.5000
   5.9000   6.5334   7.0853
   6.2196   6.7508   7.7000
Which measurements a forest relies on: permuting a petal measurement among each tree's out-of-bag flowers raises the error the most.
 load fisheriris
 rng (42);
 B = TreeBagger (50, meas, species, 'OOBPredictorImportance', 'on');
 bar (B.OOBPermutedPredictorDeltaError);
 set (gca, 'xticklabel', {'SL', 'SW', 'PL', 'PW'});
 ylabel ('Rise in out-of-bag error');
Scale the proximities of a random forest to two dimensions and draw the flowers one color per species.
 load fisheriris
 rng (42);
 B = fillprox (TreeBagger (50, meas, species));
 mdsprox (B, 'Colors', 'rgb');
A logical scalar, false unless the ensemble was fitted with
'OOBPredictorImportance' set to 'on', which keeps the
out-of-bag information too. This property is read-only.
Grow a random forest on the iris data, estimate its error from the observations each tree left out, and classify a new flower.
 load fisheriris
 rng (42);
 B = TreeBagger (50, meas, species, 'OOBPrediction', 'on');
 err = oobError (B);
 err(end)
ans = 0.053333
label = predict (B, [5.8, 2.8, 4.5, 1.4])
label =
  1x1 cell array

    {'versicolor'}
A regression forest predicting sepal length from the other three measurements, with the spread of its trees around each prediction.
 load fisheriris
 rng (42);
 B = TreeBagger (50, meas(:,2:4), meas(:,1), 'Method', 'regression');
 [yfit, sd] = predict (B, meas([1, 51, 101], 2:4))
yfit =

   5.0382
   6.5283
   6.8350

sd =

   0.1101
   0.1816
   0.3976
A 90% prediction interval for sepal length from the other three measurements, read off the quantiles of a regression forest.
 load fisheriris
 rng (42);
 B = TreeBagger (100, meas(:,2:4), meas(:,1), 'Method', 'regression');
 q = quantilePredict (B, meas([1, 51, 101], 2:4), ...
                      'Quantile', [0.05, 0.5, 0.95])
q =

   4.6000   5.0463   5.5000
   5.9000   6.5334   7.0853
   6.2196   6.7508   7.7000
Which measurements a forest relies on: permuting a petal measurement among each tree's out-of-bag flowers raises the error the most.
 load fisheriris
 rng (42);
 B = TreeBagger (50, meas, species, 'OOBPredictorImportance', 'on');
 bar (B.OOBPermutedPredictorDeltaError);
 set (gca, 'xticklabel', {'SL', 'SW', 'PL', 'PW'});
 ylabel ('Rise in out-of-bag error');
Scale the proximities of a random forest to two dimensions and draw the flowers one color per species.
 load fisheriris
 rng (42);
 B = fillprox (TreeBagger (50, meas, species));
 mdsprox (B, 'Colors', 'rgb');
An NxNumTrees logical matrix, true where an observation is not
in a tree’s sample. Empty unless ComputeOOBPrediction is true.
This property is read-only.
Grow a random forest on the iris data, estimate its error from the observations each tree left out, and classify a new flower.
 load fisheriris
 rng (42);
 B = TreeBagger (50, meas, species, 'OOBPrediction', 'on');
 err = oobError (B);
 err(end)
ans = 0.053333
label = predict (B, [5.8, 2.8, 4.5, 1.4])
label =
  1x1 cell array

    {'versicolor'}
A regression forest predicting sepal length from the other three measurements, with the spread of its trees around each prediction.
 load fisheriris
 rng (42);
 B = TreeBagger (50, meas(:,2:4), meas(:,1), 'Method', 'regression');
 [yfit, sd] = predict (B, meas([1, 51, 101], 2:4))
yfit =

   5.0382
   6.5283
   6.8350

sd =

   0.1101
   0.1816
   0.3976
A 90% prediction interval for sepal length from the other three measurements, read off the quantiles of a regression forest.
 load fisheriris
 rng (42);
 B = TreeBagger (100, meas(:,2:4), meas(:,1), 'Method', 'regression');
 q = quantilePredict (B, meas([1, 51, 101], 2:4), ...
                      'Quantile', [0.05, 0.5, 0.95])
q =

   4.6000   5.0463   5.5000
   5.9000   6.5334   7.0853
   6.2196   6.7508   7.7000
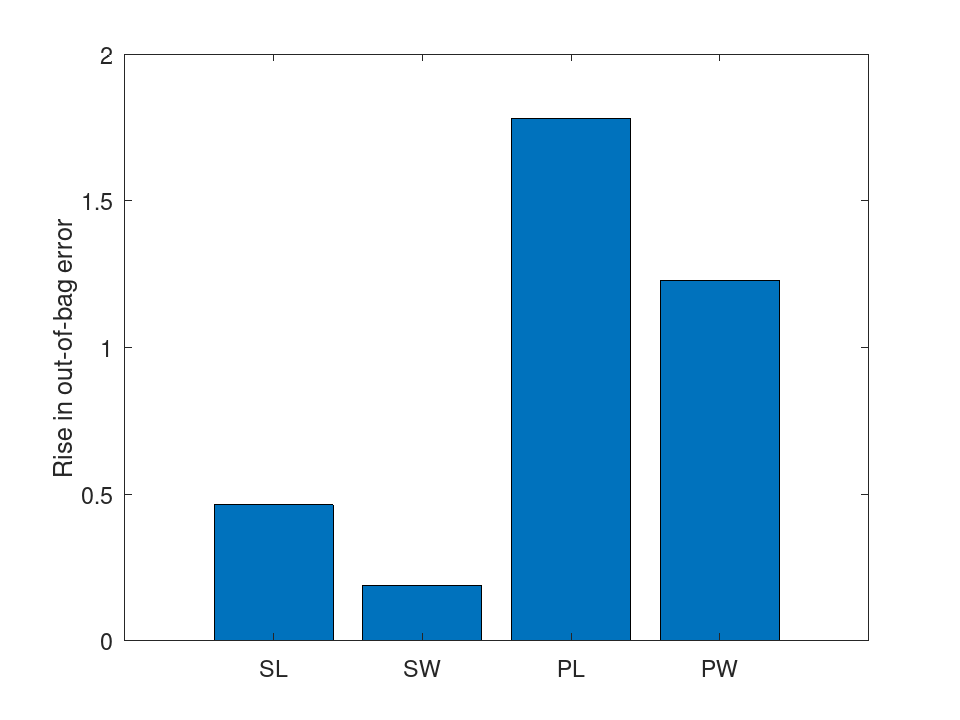
Which measurements a forest relies on: permuting a petal measurement among each tree's out-of-bag flowers raises the error the most.
 load fisheriris
 rng (42);
 B = TreeBagger (50, meas, species, 'OOBPredictorImportance', 'on');
 bar (B.OOBPermutedPredictorDeltaError);
 set (gca, 'xticklabel', {'SL', 'SW', 'PL', 'PW'});
 ylabel ('Rise in out-of-bag error');
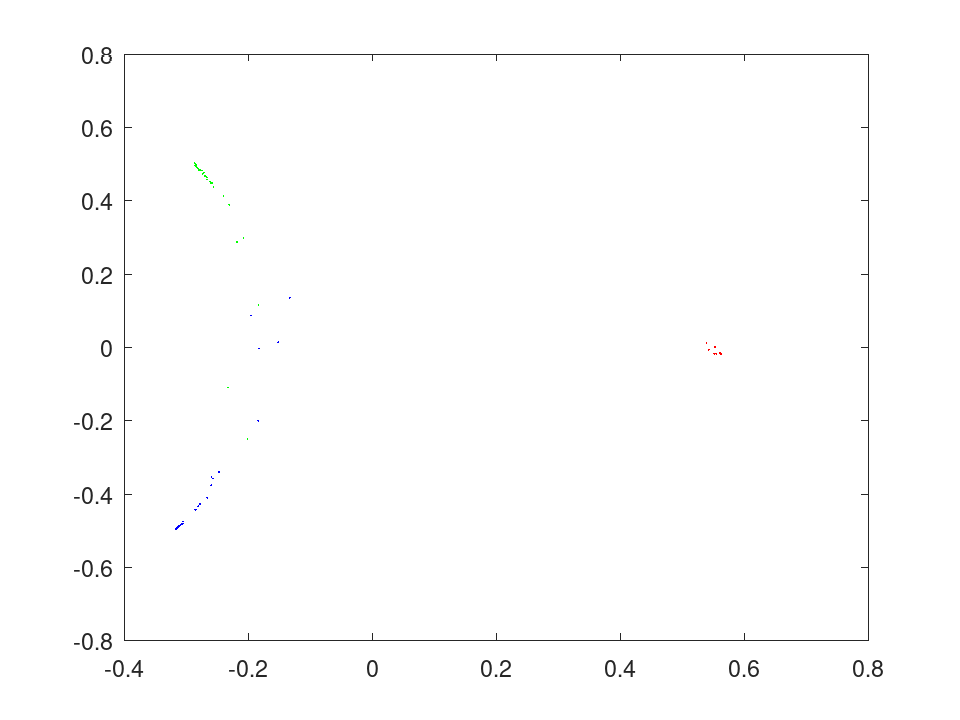
Scale the proximities of a random forest to two dimensions and draw the flowers one color per species.
 load fisheriris
 rng (42);
 B = fillprox (TreeBagger (50, meas, species));
 mdsprox (B, 'Colors', 'rgb');
A column with one count per observation. Empty unless
ComputeOOBPrediction is true. This property is read-only.
Grow a random forest on the iris data, estimate its error from the observations each tree left out, and classify a new flower.
 load fisheriris
 rng (42);
 B = TreeBagger (50, meas, species, 'OOBPrediction', 'on');
 err = oobError (B);
 err(end)
ans = 0.053333
label = predict (B, [5.8, 2.8, 4.5, 1.4])
label =
  1x1 cell array

    {'versicolor'}
A regression forest predicting sepal length from the other three measurements, with the spread of its trees around each prediction.
 load fisheriris
 rng (42);
 B = TreeBagger (50, meas(:,2:4), meas(:,1), 'Method', 'regression');
 [yfit, sd] = predict (B, meas([1, 51, 101], 2:4))
yfit =

   5.0382
   6.5283
   6.8350

sd =

   0.1101
   0.1816
   0.3976
A 90% prediction interval for sepal length from the other three measurements, read off the quantiles of a regression forest.
 load fisheriris
 rng (42);
 B = TreeBagger (100, meas(:,2:4), meas(:,1), 'Method', 'regression');
 q = quantilePredict (B, meas([1, 51, 101], 2:4), ...
                      'Quantile', [0.05, 0.5, 0.95])
q =

   4.6000   5.0463   5.5000
   5.9000   6.5334   7.0853
   6.2196   6.7508   7.7000
Which measurements a forest relies on: permuting a petal measurement among each tree's out-of-bag flowers raises the error the most.
 load fisheriris
 rng (42);
 B = TreeBagger (50, meas, species, 'OOBPredictorImportance', 'on');
 bar (B.OOBPermutedPredictorDeltaError);
 set (gca, 'xticklabel', {'SL', 'SW', 'PL', 'PW'});
 ylabel ('Rise in out-of-bag error');
Scale the proximities of a random forest to two dimensions and draw the flowers one color per species.
 load fisheriris
 rng (42);
 B = fillprox (TreeBagger (50, meas, species));
 mdsprox (B, 'Colors', 'rgb');
A row vector with one element per predictor, the mean over the trees
of each tree’s predictorImportance. This property is read-only.
Grow a random forest on the iris data, estimate its error from the observations each tree left out, and classify a new flower.
 load fisheriris
 rng (42);
 B = TreeBagger (50, meas, species, 'OOBPrediction', 'on');
 err = oobError (B);
 err(end)
ans = 0.053333
label = predict (B, [5.8, 2.8, 4.5, 1.4])
label =
  1x1 cell array

    {'versicolor'}
A regression forest predicting sepal length from the other three measurements, with the spread of its trees around each prediction.
 load fisheriris
 rng (42);
 B = TreeBagger (50, meas(:,2:4), meas(:,1), 'Method', 'regression');
 [yfit, sd] = predict (B, meas([1, 51, 101], 2:4))
yfit =

   5.0382
   6.5283
   6.8350

sd =

   0.1101
   0.1816
   0.3976
A 90% prediction interval for sepal length from the other three measurements, read off the quantiles of a regression forest.
 load fisheriris
 rng (42);
 B = TreeBagger (100, meas(:,2:4), meas(:,1), 'Method', 'regression');
 q = quantilePredict (B, meas([1, 51, 101], 2:4), ...
                      'Quantile', [0.05, 0.5, 0.95])
q =

   4.6000   5.0463   5.5000
   5.9000   6.5334   7.0853
   6.2196   6.7508   7.7000
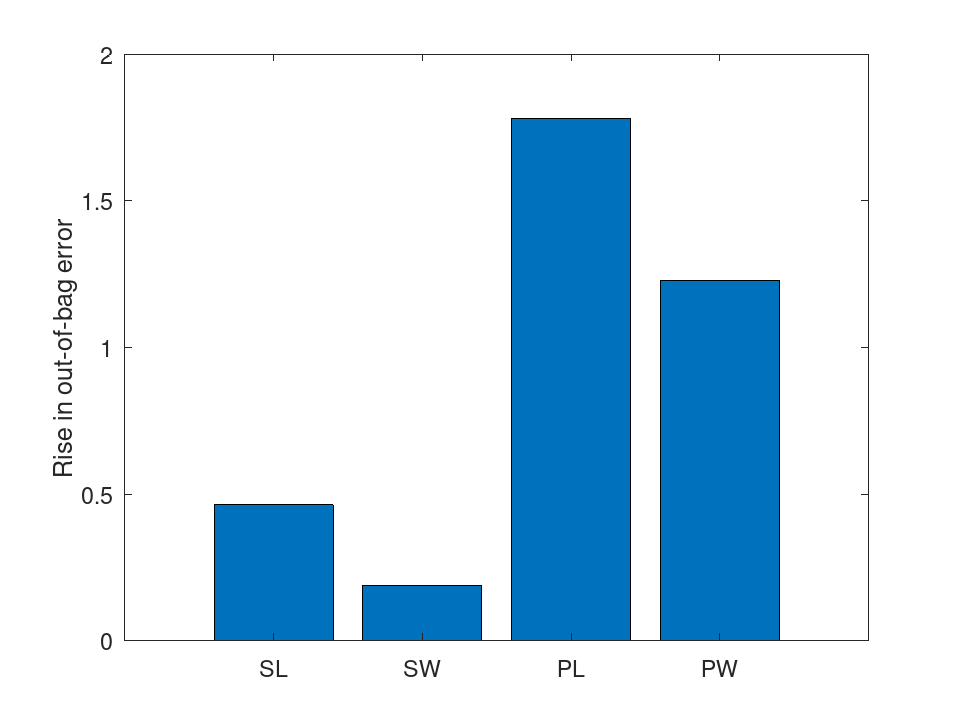
Which measurements a forest relies on: permuting a petal measurement among each tree's out-of-bag flowers raises the error the most.
 load fisheriris
 rng (42);
 B = TreeBagger (50, meas, species, 'OOBPredictorImportance', 'on');
 bar (B.OOBPermutedPredictorDeltaError);
 set (gca, 'xticklabel', {'SL', 'SW', 'PL', 'PW'});
 ylabel ('Rise in out-of-bag error');
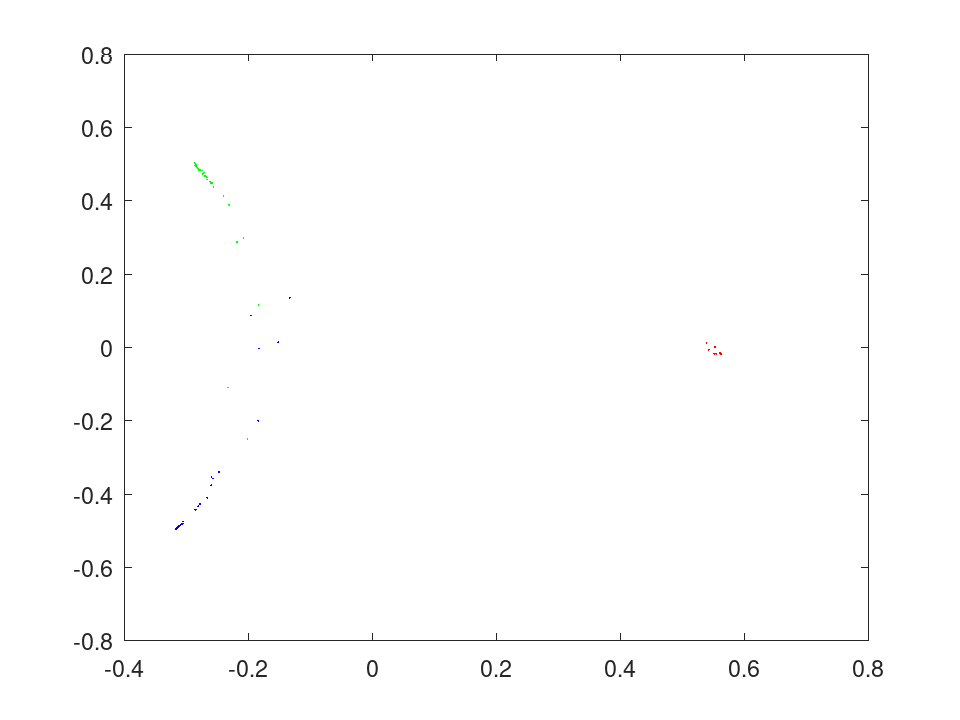
Scale the proximities of a random forest to two dimensions and draw the flowers one color per species.
 load fisheriris
 rng (42);
 B = fillprox (TreeBagger (50, meas, species));
 mdsprox (B, 'Colors', 'rgb');
A row vector with one element per predictor, the sum over the trees of the share of each tree’s branch nodes that split on the predictor. A tree without branch nodes adds nothing. This property is read-only.
Grow a random forest on the iris data, estimate its error from the observations each tree left out, and classify a new flower.
 load fisheriris
 rng (42);
 B = TreeBagger (50, meas, species, 'OOBPrediction', 'on');
 err = oobError (B);
 err(end)
ans = 0.053333
label = predict (B, [5.8, 2.8, 4.5, 1.4])
label =
  1x1 cell array

    {'versicolor'}
A regression forest predicting sepal length from the other three measurements, with the spread of its trees around each prediction.
 load fisheriris
 rng (42);
 B = TreeBagger (50, meas(:,2:4), meas(:,1), 'Method', 'regression');
 [yfit, sd] = predict (B, meas([1, 51, 101], 2:4))
yfit =

   5.0382
   6.5283
   6.8350

sd =

   0.1101
   0.1816
   0.3976
A 90% prediction interval for sepal length from the other three measurements, read off the quantiles of a regression forest.
 load fisheriris
 rng (42);
 B = TreeBagger (100, meas(:,2:4), meas(:,1), 'Method', 'regression');
 q = quantilePredict (B, meas([1, 51, 101], 2:4), ...
                      'Quantile', [0.05, 0.5, 0.95])
q =

   4.6000   5.0463   5.5000
   5.9000   6.5334   7.0853
   6.2196   6.7508   7.7000
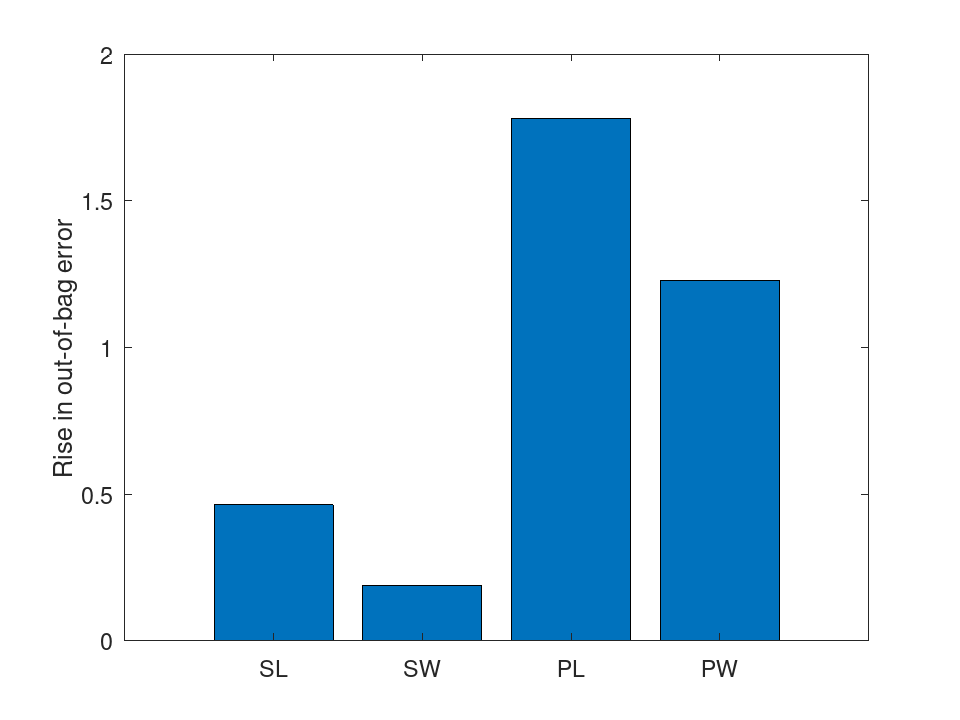
Which measurements a forest relies on: permuting a petal measurement among each tree's out-of-bag flowers raises the error the most.
 load fisheriris
 rng (42);
 B = TreeBagger (50, meas, species, 'OOBPredictorImportance', 'on');
 bar (B.OOBPermutedPredictorDeltaError);
 set (gca, 'xticklabel', {'SL', 'SW', 'PL', 'PW'});
 ylabel ('Rise in out-of-bag error');
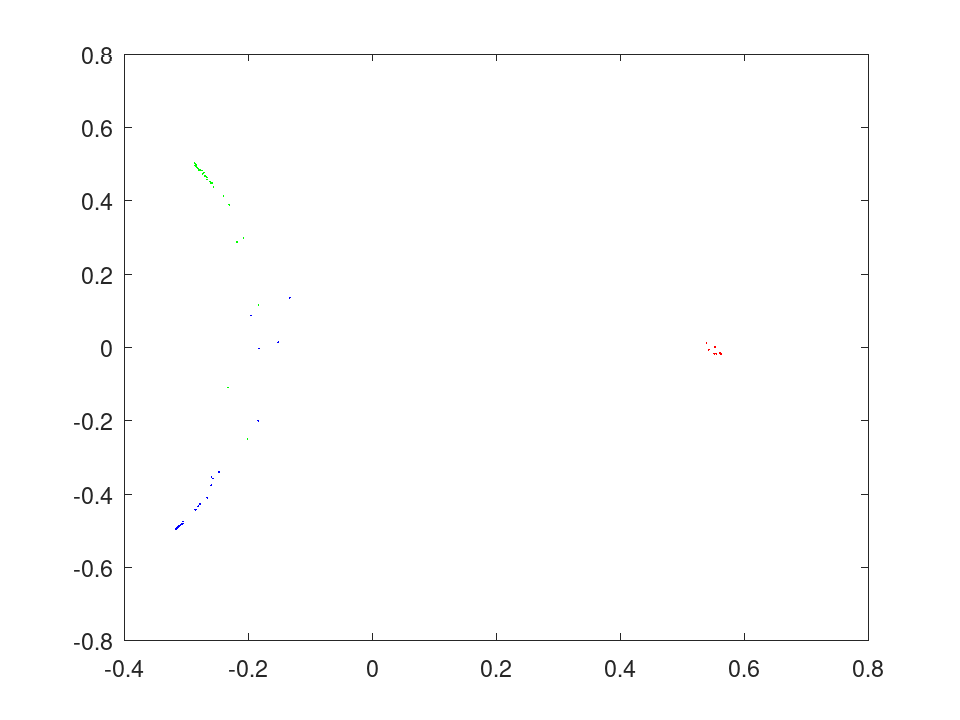
Scale the proximities of a random forest to two dimensions and draw the flowers one color per species.
 load fisheriris
 rng (42);
 B = fillprox (TreeBagger (50, meas, species));
 mdsprox (B, 'Colors', 'rgb');
A square matrix with one row and one column per predictor. The trees grow no surrogate splits, so it is the identity matrix. This property is read-only.
Grow a random forest on the iris data, estimate its error from the observations each tree left out, and classify a new flower.
 load fisheriris
 rng (42);
 B = TreeBagger (50, meas, species, 'OOBPrediction', 'on');
 err = oobError (B);
 err(end)
ans = 0.053333
label = predict (B, [5.8, 2.8, 4.5, 1.4])
label =
  1x1 cell array

    {'versicolor'}
A regression forest predicting sepal length from the other three measurements, with the spread of its trees around each prediction.
 load fisheriris
 rng (42);
 B = TreeBagger (50, meas(:,2:4), meas(:,1), 'Method', 'regression');
 [yfit, sd] = predict (B, meas([1, 51, 101], 2:4))
yfit =

   5.0382
   6.5283
   6.8350

sd =

   0.1101
   0.1816
   0.3976
A 90% prediction interval for sepal length from the other three measurements, read off the quantiles of a regression forest.
 load fisheriris
 rng (42);
 B = TreeBagger (100, meas(:,2:4), meas(:,1), 'Method', 'regression');
 q = quantilePredict (B, meas([1, 51, 101], 2:4), ...
                      'Quantile', [0.05, 0.5, 0.95])
q =

   4.6000   5.0463   5.5000
   5.9000   6.5334   7.0853
   6.2196   6.7508   7.7000
Which measurements a forest relies on: permuting a petal measurement among each tree's out-of-bag flowers raises the error the most.
 load fisheriris
 rng (42);
 B = TreeBagger (50, meas, species, 'OOBPredictorImportance', 'on');
 bar (B.OOBPermutedPredictorDeltaError);
 set (gca, 'xticklabel', {'SL', 'SW', 'PL', 'PW'});
 ylabel ('Rise in out-of-bag error');
Scale the proximities of a random forest to two dimensions and draw the flowers one color per species.
 load fisheriris
 rng (42);
 B = fillprox (TreeBagger (50, meas, species));
 mdsprox (B, 'Colors', 'rgb');
A row vector with one element per predictor. For each tree, the
values of the predictor are permuted among the observations out of its
bag, and the tree’s error on them, the misclassification share or the
mean squared error weighted by W, is taken before and after.
The element is the mean of the rise over the trees divided by its
standard deviation over the trees, zero when the mean is zero. Reading
it is an error unless ComputeOOBPredictorImportance is true.
This property is read-only.
Grow a random forest on the iris data, estimate its error from the observations each tree left out, and classify a new flower.
 load fisheriris
 rng (42);
 B = TreeBagger (50, meas, species, 'OOBPrediction', 'on');
 err = oobError (B);
 err(end)
ans = 0.053333
label = predict (B, [5.8, 2.8, 4.5, 1.4])
label =
  1x1 cell array

    {'versicolor'}
A regression forest predicting sepal length from the other three measurements, with the spread of its trees around each prediction.
 load fisheriris
 rng (42);
 B = TreeBagger (50, meas(:,2:4), meas(:,1), 'Method', 'regression');
 [yfit, sd] = predict (B, meas([1, 51, 101], 2:4))
yfit =

   5.0382
   6.5283
   6.8350

sd =

   0.1101
   0.1816
   0.3976
A 90% prediction interval for sepal length from the other three measurements, read off the quantiles of a regression forest.
 load fisheriris
 rng (42);
 B = TreeBagger (100, meas(:,2:4), meas(:,1), 'Method', 'regression');
 q = quantilePredict (B, meas([1, 51, 101], 2:4), ...
                      'Quantile', [0.05, 0.5, 0.95])
q =

   4.6000   5.0463   5.5000
   5.9000   6.5334   7.0853
   6.2196   6.7508   7.7000
Which measurements a forest relies on: permuting a petal measurement among each tree's out-of-bag flowers raises the error the most.
 load fisheriris
 rng (42);
 B = TreeBagger (50, meas, species, 'OOBPredictorImportance', 'on');
 bar (B.OOBPermutedPredictorDeltaError);
 set (gca, 'xticklabel', {'SL', 'SW', 'PL', 'PW'});
 ylabel ('Rise in out-of-bag error');
Scale the proximities of a random forest to two dimensions and draw the flowers one color per species.
 load fisheriris
 rng (42);
 B = fillprox (TreeBagger (50, meas, species));
 mdsprox (B, 'Colors', 'rgb');
A row vector with one element per predictor, computed as
OOBPermutedPredictorDeltaError is from each tree’s weighted mean
classification margin on its out-of-bag observations, before the
permutation less after it. Empty for a regression ensemble. Reading
it is an error unless ComputeOOBPredictorImportance is true.
This property is read-only.
Grow a random forest on the iris data, estimate its error from the observations each tree left out, and classify a new flower.
 load fisheriris
 rng (42);
 B = TreeBagger (50, meas, species, 'OOBPrediction', 'on');
 err = oobError (B);
 err(end)
ans = 0.053333
label = predict (B, [5.8, 2.8, 4.5, 1.4])
label =
  1x1 cell array

    {'versicolor'}
A regression forest predicting sepal length from the other three measurements, with the spread of its trees around each prediction.
 load fisheriris
 rng (42);
 B = TreeBagger (50, meas(:,2:4), meas(:,1), 'Method', 'regression');
 [yfit, sd] = predict (B, meas([1, 51, 101], 2:4))
yfit =

   5.0382
   6.5283
   6.8350

sd =

   0.1101
   0.1816
   0.3976
A 90% prediction interval for sepal length from the other three measurements, read off the quantiles of a regression forest.
 load fisheriris
 rng (42);
 B = TreeBagger (100, meas(:,2:4), meas(:,1), 'Method', 'regression');
 q = quantilePredict (B, meas([1, 51, 101], 2:4), ...
                      'Quantile', [0.05, 0.5, 0.95])
q =

   4.6000   5.0463   5.5000
   5.9000   6.5334   7.0853
   6.2196   6.7508   7.7000
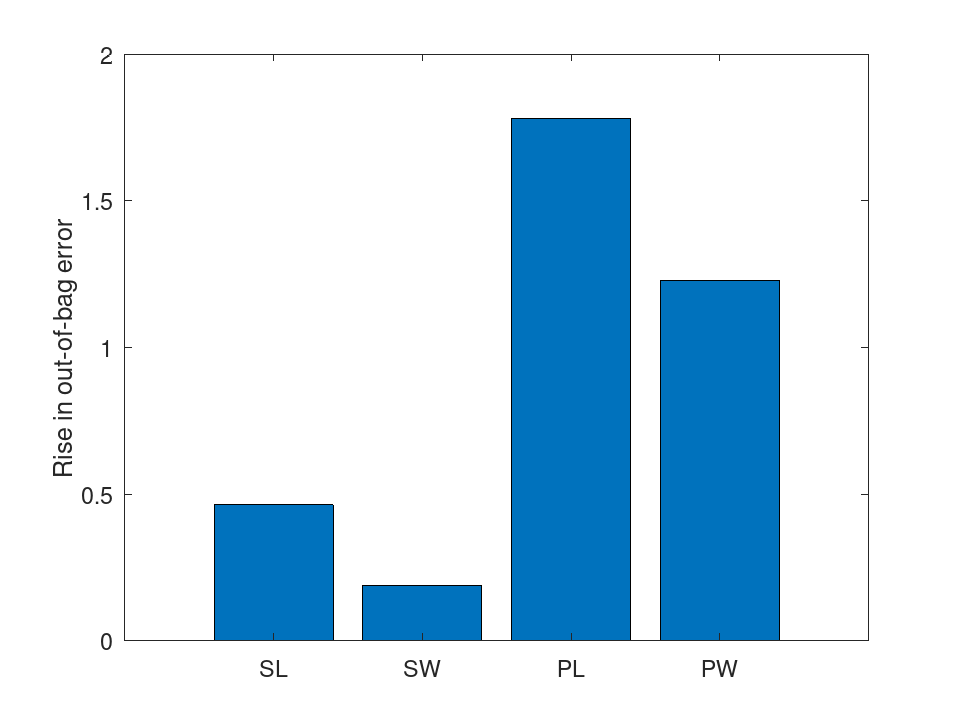
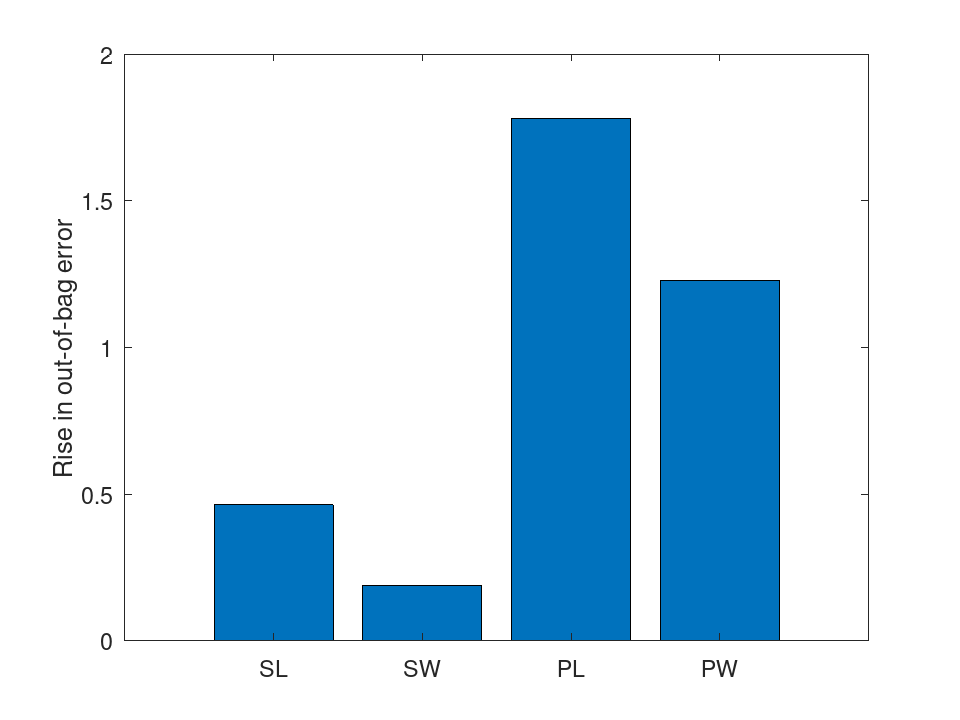
Which measurements a forest relies on: permuting a petal measurement among each tree's out-of-bag flowers raises the error the most.
 load fisheriris
 rng (42);
 B = TreeBagger (50, meas, species, 'OOBPredictorImportance', 'on');
 bar (B.OOBPermutedPredictorDeltaError);
 set (gca, 'xticklabel', {'SL', 'SW', 'PL', 'PW'});
 ylabel ('Rise in out-of-bag error');
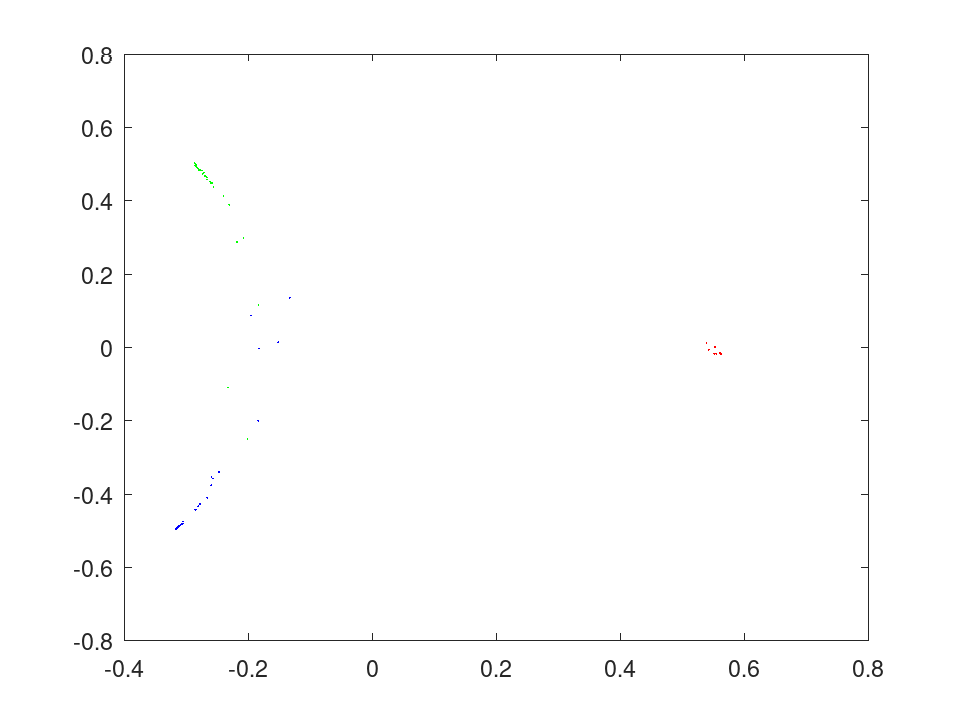
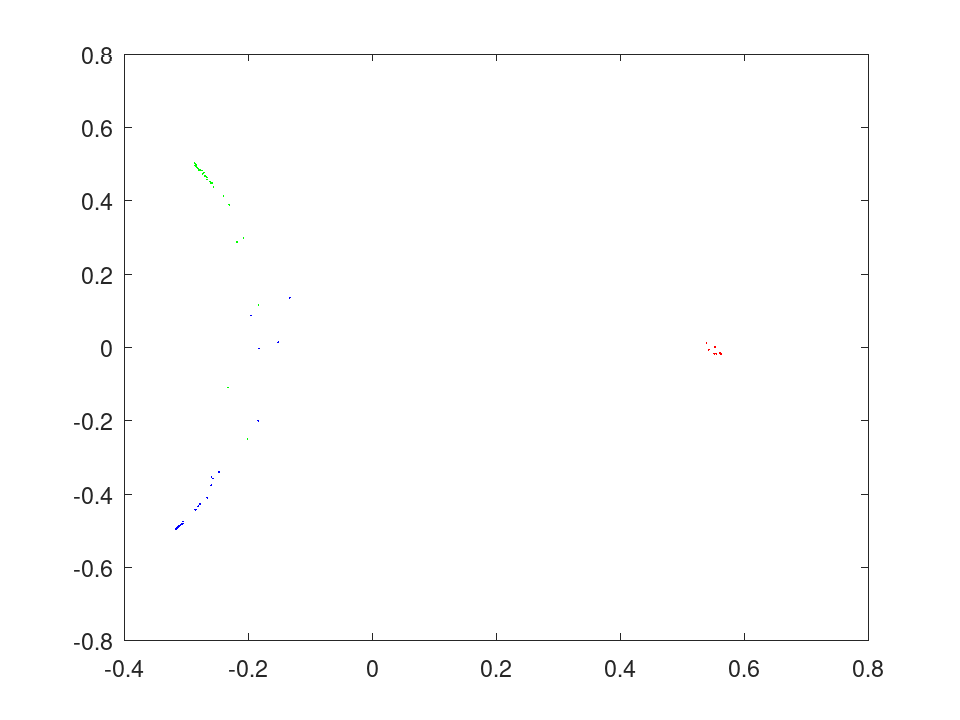
Scale the proximities of a random forest to two dimensions and draw the flowers one color per species.
 load fisheriris
 rng (42);
 B = fillprox (TreeBagger (50, meas, species));
 mdsprox (B, 'Colors', 'rgb');
A row vector with one element per predictor, computed as
OOBPermutedPredictorDeltaError is from the number of each tree’s
out-of-bag observations whose margin the permutation lowers less the
number whose margin it raises. Empty for a regression ensemble.
Reading it is an error unless ComputeOOBPredictorImportance is
true. This property is read-only.
Grow a random forest on the iris data, estimate its error from the observations each tree left out, and classify a new flower.
load fisheriris rng (42); B = TreeBagger (50, meas, species, 'OOBPrediction', 'on'); err = oobError (B); err(end)
ans = 0.053333
label = predict (B, [5.8, 2.8, 4.5, 1.4])
label =
1x1 cell array
{'versicolor'}
A regression forest predicting sepal length from the other three measurements, with the spread of its trees around each prediction.
load fisheriris rng (42); B = TreeBagger (50, meas(:,2:4), meas(:,1), 'Method', 'regression'); [yfit, sd] = predict (B, meas([1, 51, 101], 2:4))
yfit = 5.0382 6.5283 6.8350 sd = 0.1101 0.1816 0.3976
A 90% prediction interval for sepal length from the other three measurements, read off the quantiles of a regression forest.
load fisheriris
rng (42);
B = TreeBagger (100, meas(:,2:4), meas(:,1), 'Method', 'regression');
q = quantilePredict (B, meas([1, 51, 101], 2:4), ...
'Quantile', [0.05, 0.5, 0.95])
q = 4.6000 5.0463 5.5000 5.9000 6.5334 7.0853 6.2196 6.7508 7.7000
Which measurements a forest relies on: permuting a petal measurement among each tree's out-of-bag flowers raises the error the most.
load fisheriris
rng (42);
B = TreeBagger (50, meas, species, 'OOBPredictorImportance', 'on');
bar (B.OOBPermutedPredictorDeltaError);
set (gca, 'xticklabel', {'SL', 'SW', 'PL', 'PW'});
ylabel ('Rise in out-of-bag error');
Scale the proximities of a random forest to two dimensions and draw the flowers one color per species.
load fisheriris rng (42); B = fillprox (TreeBagger (50, meas, species)); mdsprox (B, 'Colors', 'rgb');
A symmetric NxN matrix whose element (i,j) is the share
of the trees that bring training observations i and j to
the same leaf. Reading it is an error until fillprox fills it,
and growTrees and append empty it again. This property
is read-only.
Grow a random forest on the iris data, estimate its error from the observations each tree left out, and classify a new flower.
load fisheriris rng (42); B = TreeBagger (50, meas, species, 'OOBPrediction', 'on'); err = oobError (B); err(end)
ans = 0.053333
label = predict (B, [5.8, 2.8, 4.5, 1.4])
label =
1x1 cell array
{'versicolor'}
A regression forest predicting sepal length from the other three measurements, with the spread of its trees around each prediction.
load fisheriris rng (42); B = TreeBagger (50, meas(:,2:4), meas(:,1), 'Method', 'regression'); [yfit, sd] = predict (B, meas([1, 51, 101], 2:4))
yfit = 5.0382 6.5283 6.8350 sd = 0.1101 0.1816 0.3976
A 90% prediction interval for sepal length from the other three measurements, read off the quantiles of a regression forest.
load fisheriris
rng (42);
B = TreeBagger (100, meas(:,2:4), meas(:,1), 'Method', 'regression');
q = quantilePredict (B, meas([1, 51, 101], 2:4), ...
'Quantile', [0.05, 0.5, 0.95])
q = 4.6000 5.0463 5.5000 5.9000 6.5334 7.0853 6.2196 6.7508 7.7000
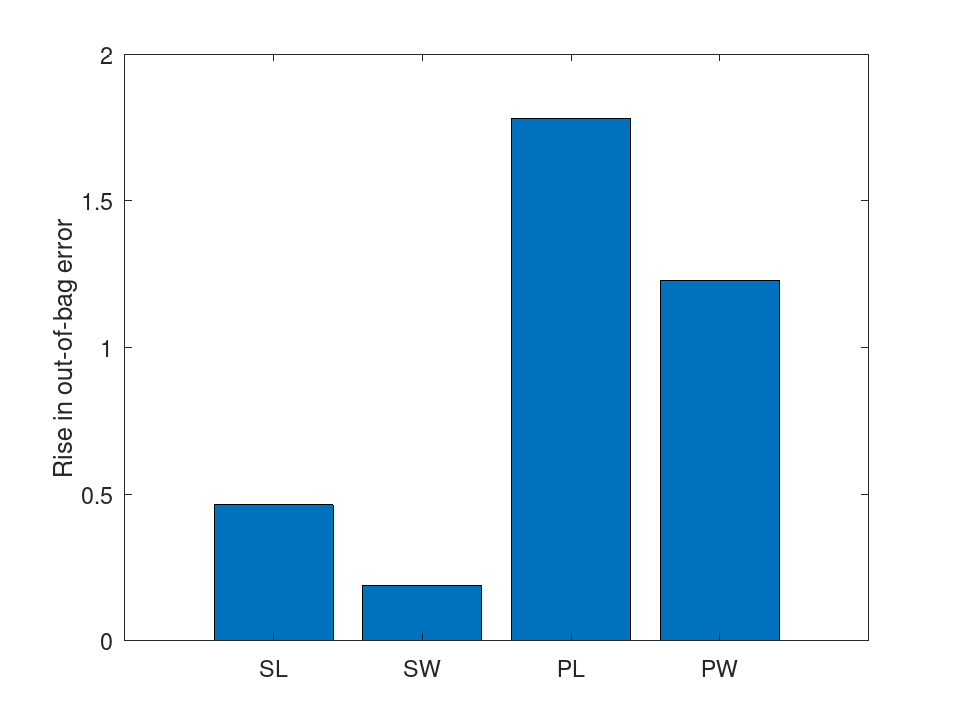
Which measurements a forest relies on: permuting a petal measurement among each tree's out-of-bag flowers raises the error the most.
load fisheriris
rng (42);
B = TreeBagger (50, meas, species, 'OOBPredictorImportance', 'on');
bar (B.OOBPermutedPredictorDeltaError);
set (gca, 'xticklabel', {'SL', 'SW', 'PL', 'PW'});
ylabel ('Rise in out-of-bag error');
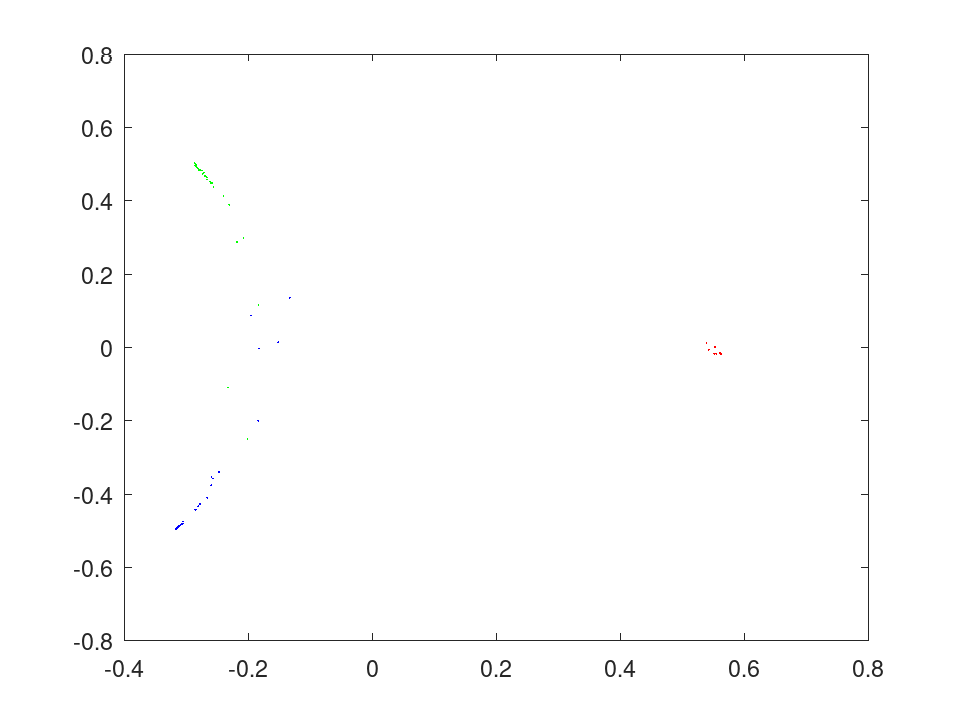
Scale the proximities of a random forest to two dimensions and draw the flowers one color per species.
load fisheriris rng (42); B = fillprox (TreeBagger (50, meas, species)); mdsprox (B, 'Colors', 'rgb');
A column with one element per observation, computed from
Proximity as CompactTreeBagger.outlierMeasure computes
it, within each class for classification and over every observation
for regression. Reading it is an error until fillprox fills it,
and growTrees and append empty it again. This property
is read-only.
Grow a random forest on the iris data, estimate its error from the observations each tree left out, and classify a new flower.
load fisheriris rng (42); B = TreeBagger (50, meas, species, 'OOBPrediction', 'on'); err = oobError (B); err(end)
ans = 0.053333
label = predict (B, [5.8, 2.8, 4.5, 1.4])
label =
1x1 cell array
{'versicolor'}
A regression forest predicting sepal length from the other three measurements, with the spread of its trees around each prediction.
load fisheriris rng (42); B = TreeBagger (50, meas(:,2:4), meas(:,1), 'Method', 'regression'); [yfit, sd] = predict (B, meas([1, 51, 101], 2:4))
yfit = 5.0382 6.5283 6.8350 sd = 0.1101 0.1816 0.3976
A 90% prediction interval for sepal length from the other three measurements, read off the quantiles of a regression forest.
load fisheriris
rng (42);
B = TreeBagger (100, meas(:,2:4), meas(:,1), 'Method', 'regression');
q = quantilePredict (B, meas([1, 51, 101], 2:4), ...
'Quantile', [0.05, 0.5, 0.95])
q = 4.6000 5.0463 5.5000 5.9000 6.5334 7.0853 6.2196 6.7508 7.7000
Which measurements a forest relies on: permuting a petal measurement among each tree's out-of-bag flowers raises the error the most.
load fisheriris
rng (42);
B = TreeBagger (50, meas, species, 'OOBPredictorImportance', 'on');
bar (B.OOBPermutedPredictorDeltaError);
set (gca, 'xticklabel', {'SL', 'SW', 'PL', 'PW'});
ylabel ('Rise in out-of-bag error');
Scale the proximities of a random forest to two dimensions and draw the flowers one color per species.
load fisheriris rng (42); B = fillprox (TreeBagger (50, meas, species)); mdsprox (B, 'Colors', 'rgb');
A logical scalar, false unless 'MergeLeaves' was set to
'on'. This property is read-only.
Grow a random forest on the iris data, estimate its error from the observations each tree left out, and classify a new flower.
load fisheriris rng (42); B = TreeBagger (50, meas, species, 'OOBPrediction', 'on'); err = oobError (B); err(end)
ans = 0.053333
label = predict (B, [5.8, 2.8, 4.5, 1.4])
label =
1x1 cell array
{'versicolor'}
A regression forest predicting sepal length from the other three measurements, with the spread of its trees around each prediction.
load fisheriris rng (42); B = TreeBagger (50, meas(:,2:4), meas(:,1), 'Method', 'regression'); [yfit, sd] = predict (B, meas([1, 51, 101], 2:4))
yfit = 5.0382 6.5283 6.8350 sd = 0.1101 0.1816 0.3976
A 90% prediction interval for sepal length from the other three measurements, read off the quantiles of a regression forest.
load fisheriris
rng (42);
B = TreeBagger (100, meas(:,2:4), meas(:,1), 'Method', 'regression');
q = quantilePredict (B, meas([1, 51, 101], 2:4), ...
'Quantile', [0.05, 0.5, 0.95])
q = 4.6000 5.0463 5.5000 5.9000 6.5334 7.0853 6.2196 6.7508 7.7000
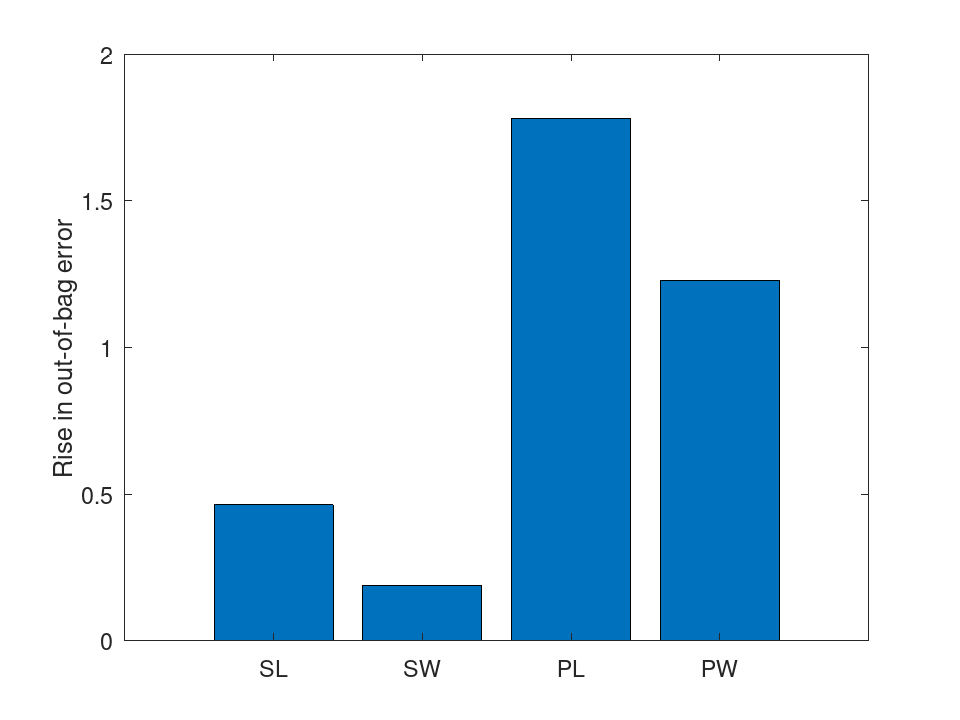
Which measurements a forest relies on: permuting a petal measurement among each tree's out-of-bag flowers raises the error the most.
load fisheriris
rng (42);
B = TreeBagger (50, meas, species, 'OOBPredictorImportance', 'on');
bar (B.OOBPermutedPredictorDeltaError);
set (gca, 'xticklabel', {'SL', 'SW', 'PL', 'PW'});
ylabel ('Rise in out-of-bag error');
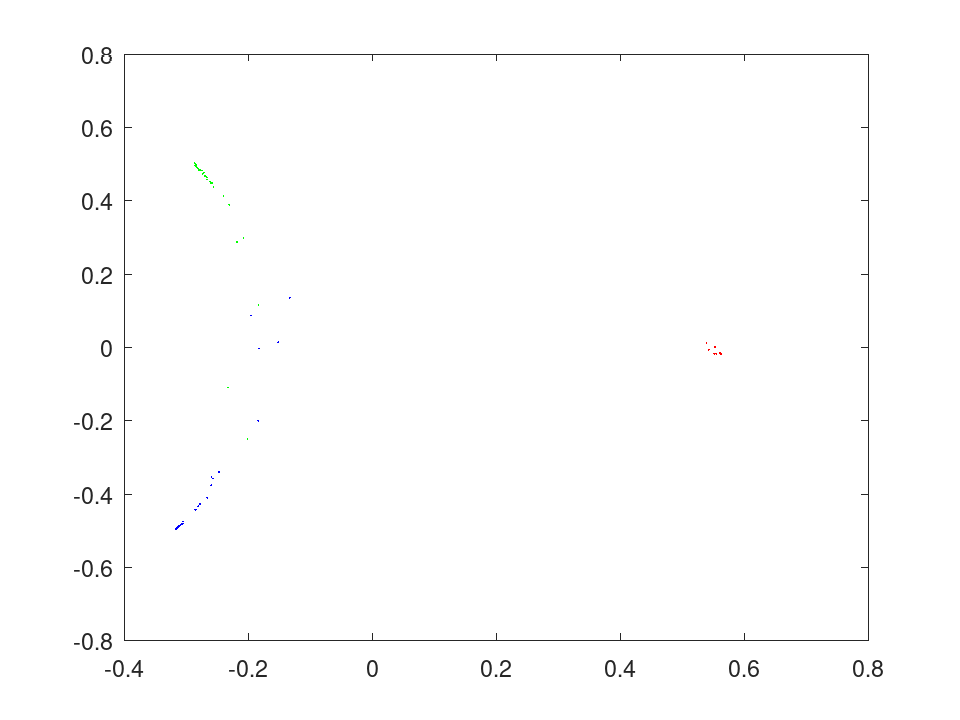
Scale the proximities of a random forest to two dimensions and draw the flowers one color per species.
load fisheriris rng (42); B = fillprox (TreeBagger (50, meas, species)); mdsprox (B, 'Colors', 'rgb');
A logical scalar, false unless 'Prune' was set to 'on'.
The trees are never pruned. This property is read-only.
Grow a random forest on the iris data, estimate its error from the observations each tree left out, and classify a new flower.
load fisheriris rng (42); B = TreeBagger (50, meas, species, 'OOBPrediction', 'on'); err = oobError (B); err(end)
ans = 0.053333
label = predict (B, [5.8, 2.8, 4.5, 1.4])
label =
1x1 cell array
{'versicolor'}
A regression forest predicting sepal length from the other three measurements, with the spread of its trees around each prediction.
load fisheriris rng (42); B = TreeBagger (50, meas(:,2:4), meas(:,1), 'Method', 'regression'); [yfit, sd] = predict (B, meas([1, 51, 101], 2:4))
yfit = 5.0382 6.5283 6.8350 sd = 0.1101 0.1816 0.3976
A 90% prediction interval for sepal length from the other three measurements, read off the quantiles of a regression forest.
load fisheriris
rng (42);
B = TreeBagger (100, meas(:,2:4), meas(:,1), 'Method', 'regression');
q = quantilePredict (B, meas([1, 51, 101], 2:4), ...
'Quantile', [0.05, 0.5, 0.95])
q = 4.6000 5.0463 5.5000 5.9000 6.5334 7.0853 6.2196 6.7508 7.7000
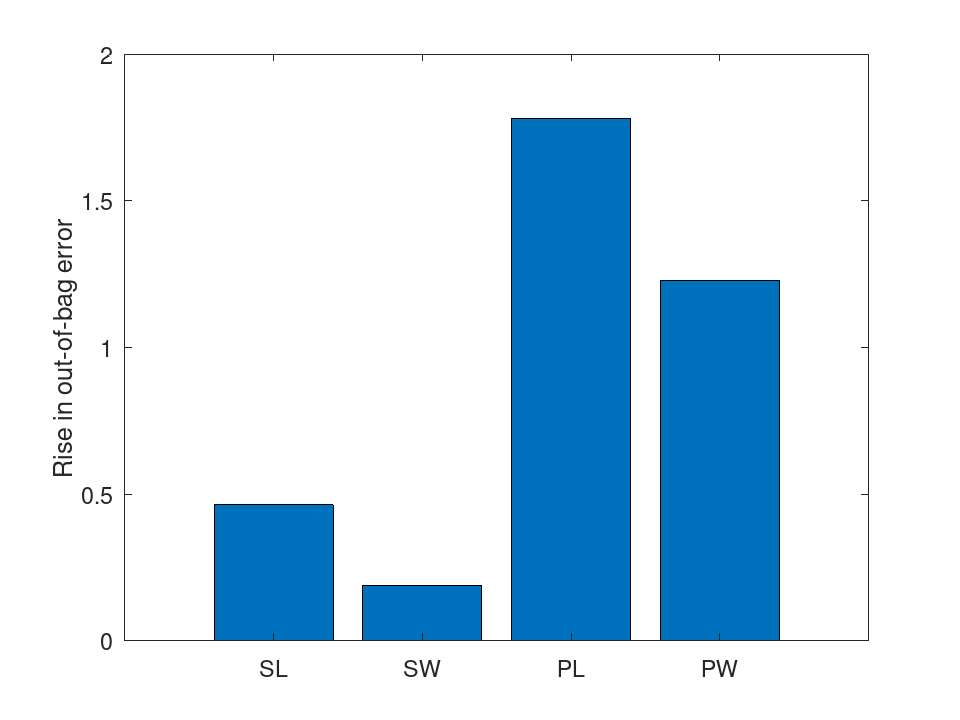
Which measurements a forest relies on: permuting a petal measurement among each tree's out-of-bag flowers raises the error the most.
load fisheriris
rng (42);
B = TreeBagger (50, meas, species, 'OOBPredictorImportance', 'on');
bar (B.OOBPermutedPredictorDeltaError);
set (gca, 'xticklabel', {'SL', 'SW', 'PL', 'PW'});
ylabel ('Rise in out-of-bag error');
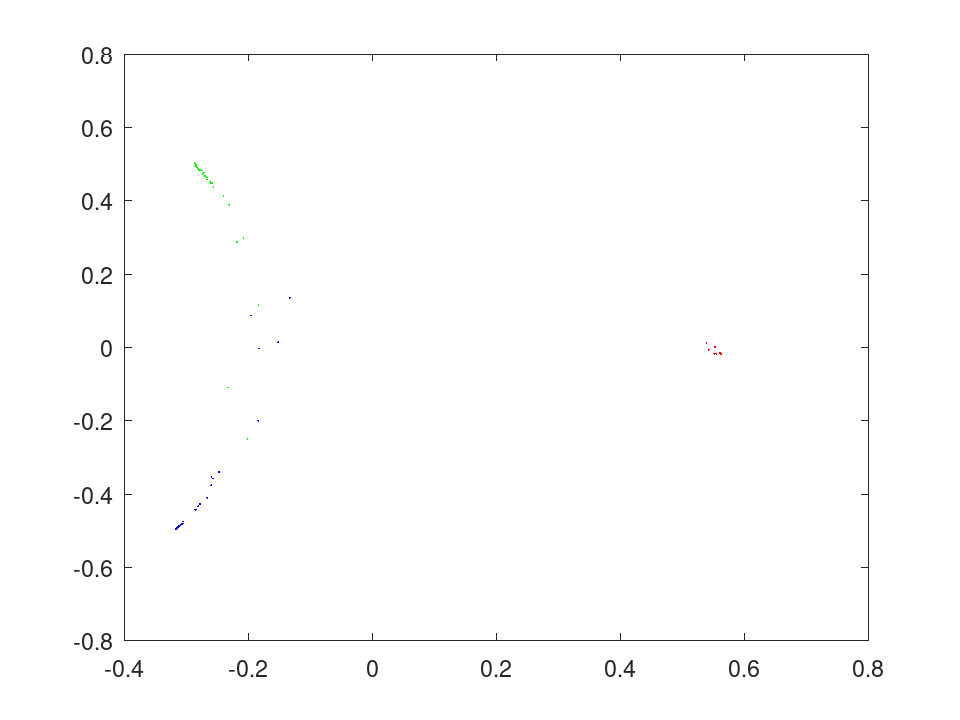
Scale the proximities of a random forest to two dimensions and draw the flowers one color per species.
load fisheriris rng (42); B = fillprox (TreeBagger (50, meas, species)); mdsprox (B, 'Colors', 'rgb');
A cell array of the Name-Value pairs given to the constructor that are passed on to every tree, in the order they were given. This property is read-only.
Grow a random forest on the iris data, estimate its error from the observations each tree left out, and classify a new flower.
load fisheriris rng (42); B = TreeBagger (50, meas, species, 'OOBPrediction', 'on'); err = oobError (B); err(end)
ans = 0.053333
label = predict (B, [5.8, 2.8, 4.5, 1.4])
label =
1x1 cell array
{'versicolor'}
A regression forest predicting sepal length from the other three measurements, with the spread of its trees around each prediction.
load fisheriris rng (42); B = TreeBagger (50, meas(:,2:4), meas(:,1), 'Method', 'regression'); [yfit, sd] = predict (B, meas([1, 51, 101], 2:4))
yfit = 5.0382 6.5283 6.8350 sd = 0.1101 0.1816 0.3976
A 90% prediction interval for sepal length from the other three measurements, read off the quantiles of a regression forest.
load fisheriris
rng (42);
B = TreeBagger (100, meas(:,2:4), meas(:,1), 'Method', 'regression');
q = quantilePredict (B, meas([1, 51, 101], 2:4), ...
'Quantile', [0.05, 0.5, 0.95])
q = 4.6000 5.0463 5.5000 5.9000 6.5334 7.0853 6.2196 6.7508 7.7000
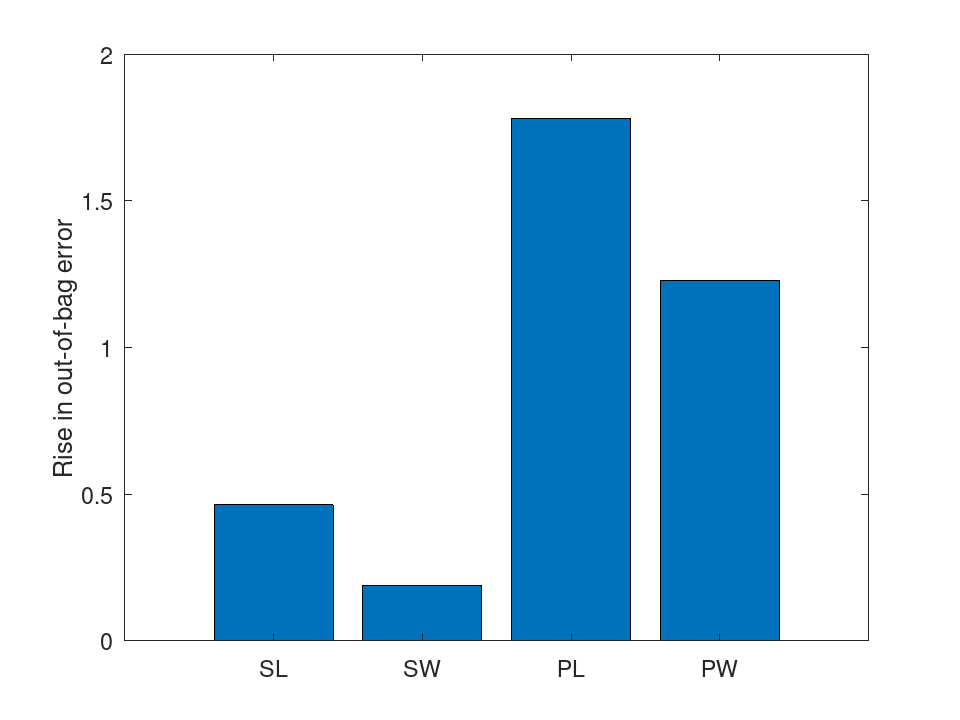
Which measurements a forest relies on: permuting a petal measurement among each tree's out-of-bag flowers raises the error the most.
load fisheriris
rng (42);
B = TreeBagger (50, meas, species, 'OOBPredictorImportance', 'on');
bar (B.OOBPermutedPredictorDeltaError);
set (gca, 'xticklabel', {'SL', 'SW', 'PL', 'PW'});
ylabel ('Rise in out-of-bag error');
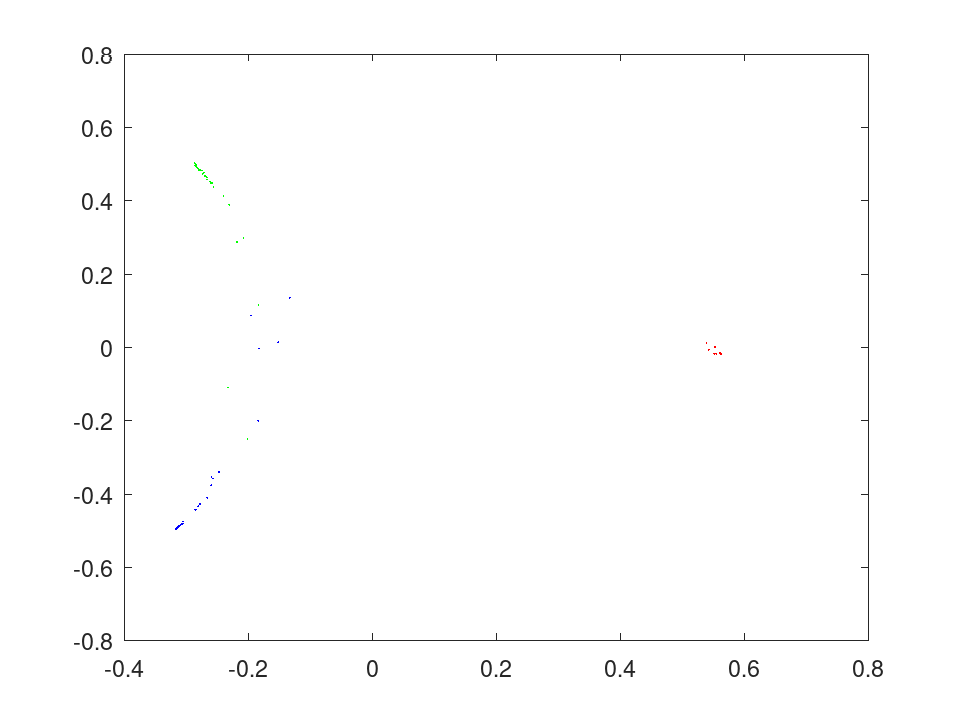
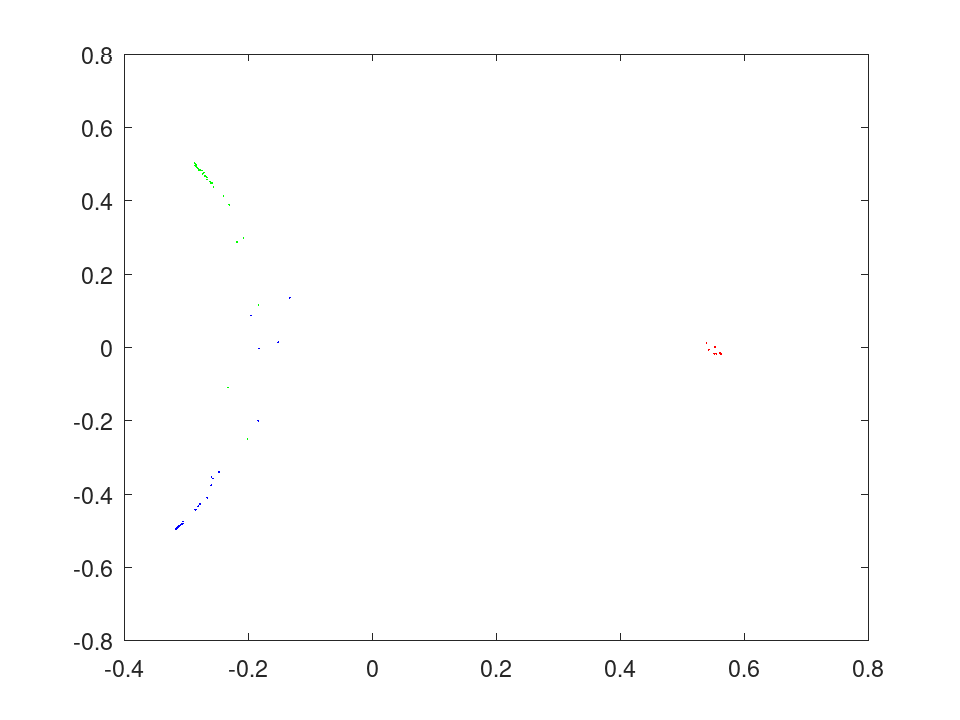
Scale the proximities of a random forest to two dimensions and draw the flowers one color per species.
load fisheriris rng (42); B = fillprox (TreeBagger (50, meas, species)); mdsprox (B, 'Colors', 'rgb');
The TreeBagger class offers the following public methods:
TreeBagger: B = TreeBagger (NumTrees, X, Y)
TreeBagger: B = TreeBagger (NumTrees, Tbl, ResponseVarName)
TreeBagger: B = TreeBagger (NumTrees, Tbl, formula)
TreeBagger: B = TreeBagger (NumTrees, Tbl, Y)
TreeBagger: B = TreeBagger (…, name, value)
B = TreeBagger (NumTrees, X, Y) grows
NumTrees classification trees on the NxP predictor matrix
X and the response Y. Y holds a class label per row,
as a numeric or logical vector, a categorical, string or character
array, or a cell array of character vectors. An observation whose
response is missing is left out; one missing a predictor is kept.
Each tree is grown on a sample of ceil (InBagFraction * N)
observations, drawn with replacement in proportion to the weights, and
chooses every split from NumPredictorsToSample predictors drawn
afresh at each node. The trees are neither pruned nor merged unless
asked. The random numbers come from Octave’s generator, so rng
reproduces an ensemble.
Name-Value arguments of the ensemble:
| Name | Value | |
|---|---|---|
'Method' | 'classification' (default) or
'regression', for a real numeric response. | |
'NumPredictorsToSample' | A positive integer or
'all'. The default is ceil (sqrt (P)) for classification
and ceil (P / 3) for regression. | |
'MinLeafSize' | A positive integer, 1 by default for classification and 5 for regression. | |
'InBagFraction' | The share of the observations in each sample, greater than 0 and no greater than 1. The default is 1. | |
'SampleWithReplacement' | 'on' (default)
or 'off'. | |
'OOBPrediction' | 'off' (default) or
'on', to keep what the out-of-bag methods need. Sampling
without replacement at an 'InBagFraction' of 1 leaves nothing
out of bag, so the two are refused together. | |
'OOBPredictorImportance' | 'off' (default)
or 'on', to estimate the importance of each predictor by
permuting it among each tree’s out-of-bag observations. It turns
'OOBPrediction' on. | |
'Weights' | A nonnegative single or double vector
with one weight per observation. The default is uniform. The model’s
W keeps the class of the weights, while every computation runs in
double. | |
'Prior' | 'empirical' (default),
'uniform', a vector with one probability per class, or a
structure with fields ClassNames and ClassProbs.
Classification only. | |
'Cost' | A square matrix of misclassification
costs, or a structure with fields ClassNames and
ClassificationCosts. Classification only. | |
'ClassNames' | The classes to fit, in the order their scores are to be laid out; observations of other classes are left out. Classification only. | |
'PredictorNames' | A cell array of character vectors naming the columns of X. | |
'NumPrint' | A nonnegative integer. After every that many trees a line saying how many are done is printed. The default, 0, prints nothing. |
'CategoricalPredictors', 'MaxNumCategories',
'MaxNumSplits', 'MergeLeaves', 'Prune',
'PruneCriterion' and 'SplitCriterion' are passed on to
every tree, and so are 'AlgorithmForCategorical' for
classification and 'QuadraticErrorTolerance' for regression;
see fitctree and fitrtree. Merging leaves is allowed but
warned against.
Surrogate splits, parallel growth and tall arrays are not implemented, and an option asking for one of them is refused.
MATLAB returns classification labels as a cell array of character
vectors whatever the type of the response; this ensemble returns them,
and its ClassNames and DefaultYfit, in the type of the
response, as every other classifier in this package does. Code that
converts MATLAB’s labels with str2double will get NaN
from a numeric response here, its labels already being numbers.
See also: TreeBagger, CompactTreeBagger, fitctree, fitrtree
Grow a random forest on the iris data, estimate its error from the observations each tree left out, and classify a new flower.
load fisheriris rng (42); B = TreeBagger (50, meas, species, 'OOBPrediction', 'on'); err = oobError (B); err(end)
ans = 0.053333
label = predict (B, [5.8, 2.8, 4.5, 1.4])
label =
1x1 cell array
{'versicolor'}
A regression forest predicting sepal length from the other three measurements, with the spread of its trees around each prediction.
load fisheriris rng (42); B = TreeBagger (50, meas(:,2:4), meas(:,1), 'Method', 'regression'); [yfit, sd] = predict (B, meas([1, 51, 101], 2:4))
yfit = 5.0382 6.5283 6.8350 sd = 0.1101 0.1816 0.3976
A 90% prediction interval for sepal length from the other three measurements, read off the quantiles of a regression forest.
load fisheriris
rng (42);
B = TreeBagger (100, meas(:,2:4), meas(:,1), 'Method', 'regression');
q = quantilePredict (B, meas([1, 51, 101], 2:4), ...
'Quantile', [0.05, 0.5, 0.95])
q = 4.6000 5.0463 5.5000 5.9000 6.5334 7.0853 6.2196 6.7508 7.7000
Which measurements a forest relies on: permuting a petal measurement among each tree's out-of-bag flowers raises the error the most.
load fisheriris
rng (42);
B = TreeBagger (50, meas, species, 'OOBPredictorImportance', 'on');
bar (B.OOBPermutedPredictorDeltaError);
set (gca, 'xticklabel', {'SL', 'SW', 'PL', 'PW'});
ylabel ('Rise in out-of-bag error');
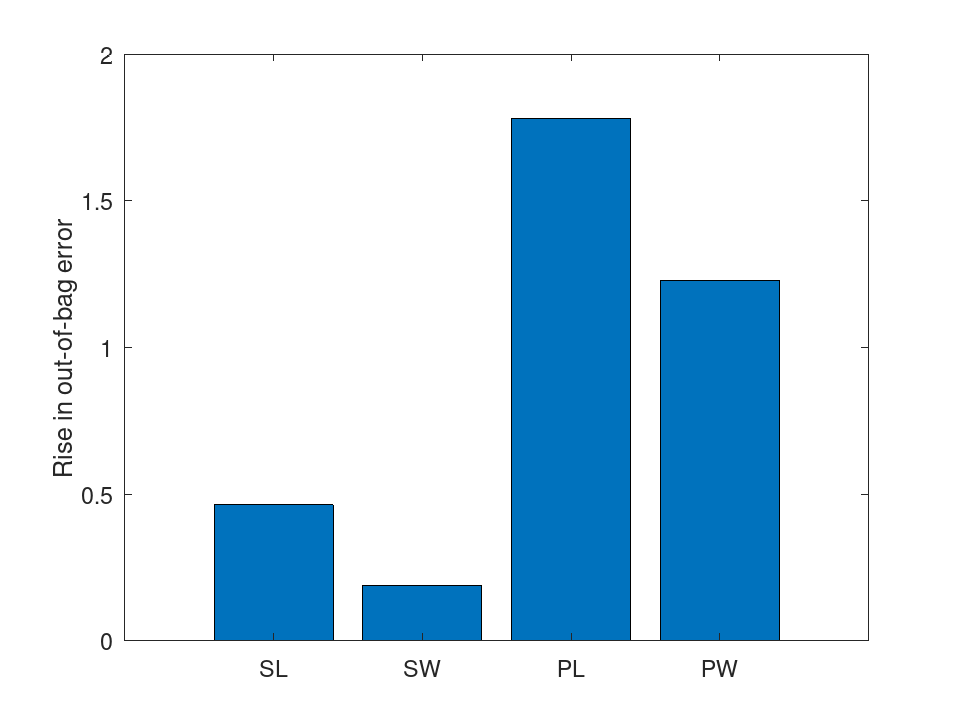
Scale the proximities of a random forest to two dimensions and draw the flowers one color per species.
load fisheriris rng (42); B = fillprox (TreeBagger (50, meas, species)); mdsprox (B, 'Colors', 'rgb');
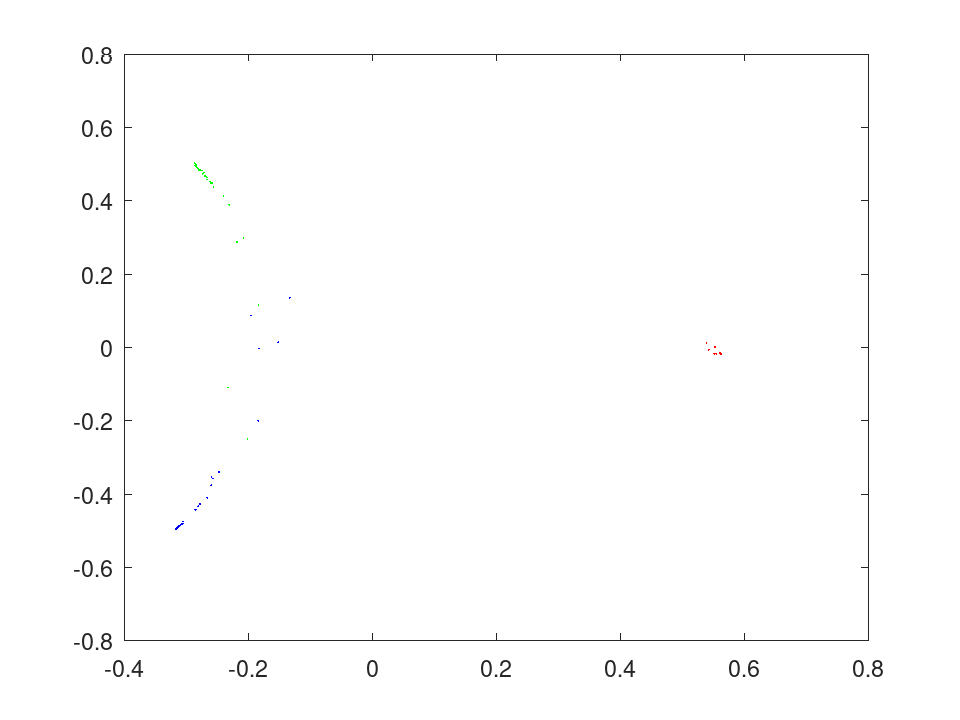
TreeBagger: label = predict (obj, X)
TreeBagger: [label, scores] = predict (…)
TreeBagger: [label, scores, stdevs] = predict (…)
TreeBagger: [Yfit, stdevs] = predict (…)
TreeBagger: … = predict (…, name, value)
Behaves as CompactTreeBagger.predict, and takes the same
'Trees', 'TreeWeights' and 'UseInstanceForTree'
Name-Value arguments.
The new data may be a table, whose variables are matched to the predictors the model was fitted on by name and not by position: one the model was not fitted on is passed over, one it needs and cannot find is named, and a value holding a level is coded as that level was coded at fitting.
See also: TreeBagger, TreeBagger.oobPredict, CompactTreeBagger.predict
Grow a random forest on the iris data, estimate its error from the observations each tree left out, and classify a new flower.
load fisheriris rng (42); B = TreeBagger (50, meas, species, 'OOBPrediction', 'on'); err = oobError (B); err(end)
ans = 0.053333
label = predict (B, [5.8, 2.8, 4.5, 1.4])
label =
1x1 cell array
{'versicolor'}
A regression forest predicting sepal length from the other three measurements, with the spread of its trees around each prediction.
load fisheriris rng (42); B = TreeBagger (50, meas(:,2:4), meas(:,1), 'Method', 'regression'); [yfit, sd] = predict (B, meas([1, 51, 101], 2:4))
yfit = 5.0382 6.5283 6.8350 sd = 0.1101 0.1816 0.3976
A 90% prediction interval for sepal length from the other three measurements, read off the quantiles of a regression forest.
load fisheriris
rng (42);
B = TreeBagger (100, meas(:,2:4), meas(:,1), 'Method', 'regression');
q = quantilePredict (B, meas([1, 51, 101], 2:4), ...
'Quantile', [0.05, 0.5, 0.95])
q = 4.6000 5.0463 5.5000 5.9000 6.5334 7.0853 6.2196 6.7508 7.7000
Which measurements a forest relies on: permuting a petal measurement among each tree's out-of-bag flowers raises the error the most.
load fisheriris
rng (42);
B = TreeBagger (50, meas, species, 'OOBPredictorImportance', 'on');
bar (B.OOBPermutedPredictorDeltaError);
set (gca, 'xticklabel', {'SL', 'SW', 'PL', 'PW'});
ylabel ('Rise in out-of-bag error');
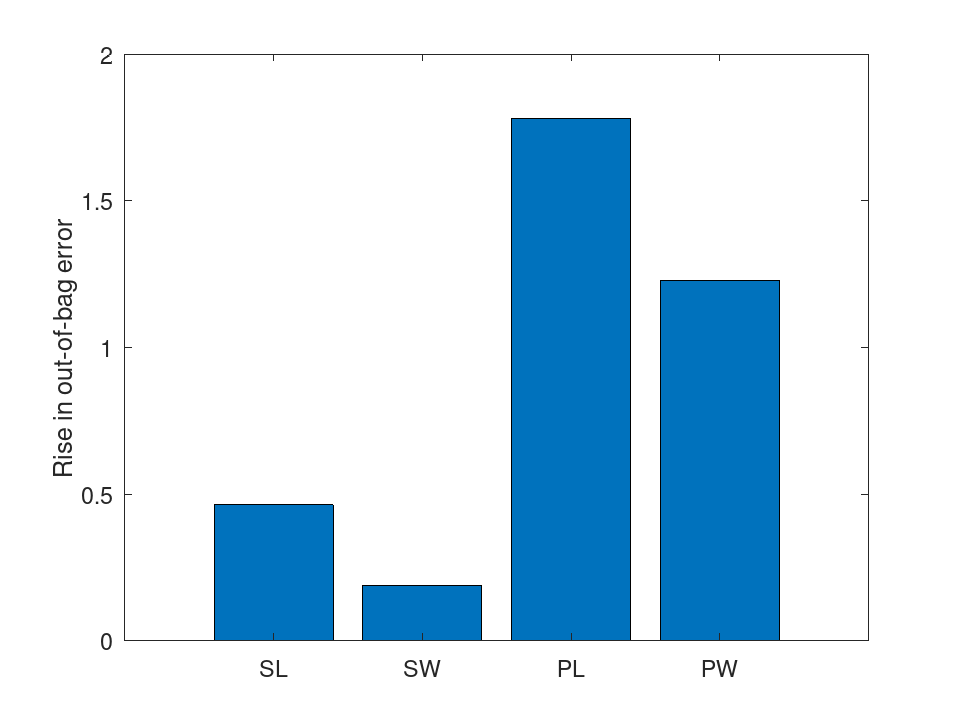
Scale the proximities of a random forest to two dimensions and draw the flowers one color per species.
load fisheriris rng (42); B = fillprox (TreeBagger (50, meas, species)); mdsprox (B, 'Colors', 'rgb');
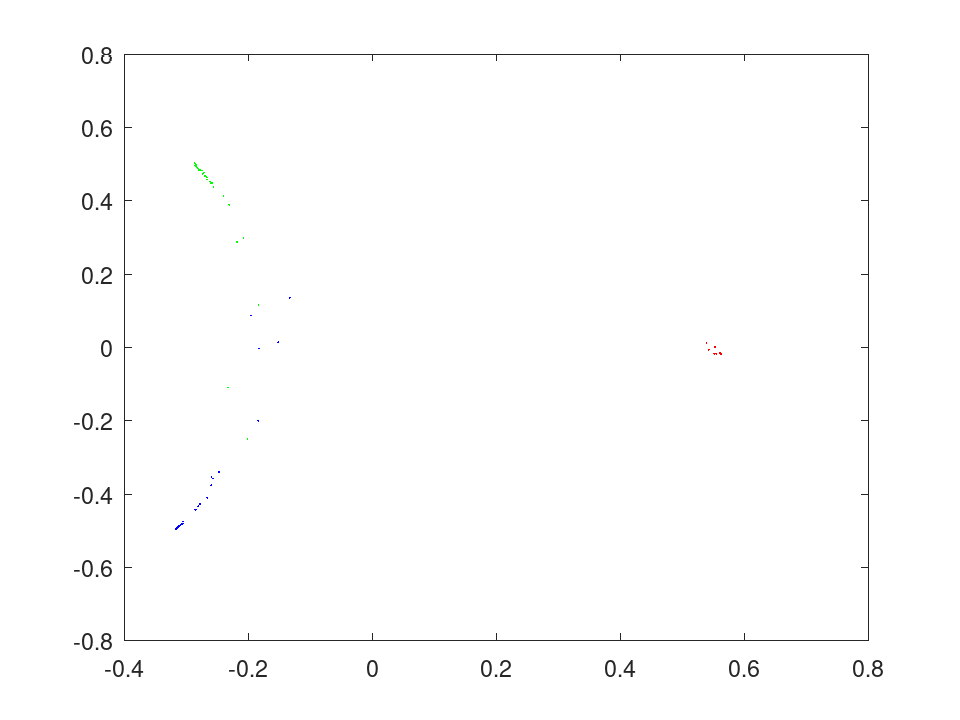
TreeBagger: label = oobPredict (obj)
TreeBagger: [label, scores, stdevs] = oobPredict (…)
TreeBagger: [Yfit, stdevs] = oobPredict (…)
TreeBagger: … = oobPredict (…, ’Trees’, trees)
Each observation is predicted by the trees whose samples left it out,
as TreeBagger.predict would with those trees alone. An
observation in the sample of every tree used takes DefaultYfit,
with the prior as its scores. 'Trees' restricts the trees.
The ensemble must have been fitted with 'OOBPrediction' on.
See also: TreeBagger, TreeBagger.oobError, TreeBagger.predict
Grow a random forest on the iris data, estimate its error from the observations each tree left out, and classify a new flower.
load fisheriris rng (42); B = TreeBagger (50, meas, species, 'OOBPrediction', 'on'); err = oobError (B); err(end)
ans = 0.053333
label = predict (B, [5.8, 2.8, 4.5, 1.4])
label =
1x1 cell array
{'versicolor'}
A regression forest predicting sepal length from the other three measurements, with the spread of its trees around each prediction.
load fisheriris rng (42); B = TreeBagger (50, meas(:,2:4), meas(:,1), 'Method', 'regression'); [yfit, sd] = predict (B, meas([1, 51, 101], 2:4))
yfit = 5.0382 6.5283 6.8350 sd = 0.1101 0.1816 0.3976
A 90% prediction interval for sepal length from the other three measurements, read off the quantiles of a regression forest.
load fisheriris
rng (42);
B = TreeBagger (100, meas(:,2:4), meas(:,1), 'Method', 'regression');
q = quantilePredict (B, meas([1, 51, 101], 2:4), ...
'Quantile', [0.05, 0.5, 0.95])
q = 4.6000 5.0463 5.5000 5.9000 6.5334 7.0853 6.2196 6.7508 7.7000
Which measurements a forest relies on: permuting a petal measurement among each tree's out-of-bag flowers raises the error the most.
load fisheriris
rng (42);
B = TreeBagger (50, meas, species, 'OOBPredictorImportance', 'on');
bar (B.OOBPermutedPredictorDeltaError);
set (gca, 'xticklabel', {'SL', 'SW', 'PL', 'PW'});
ylabel ('Rise in out-of-bag error');
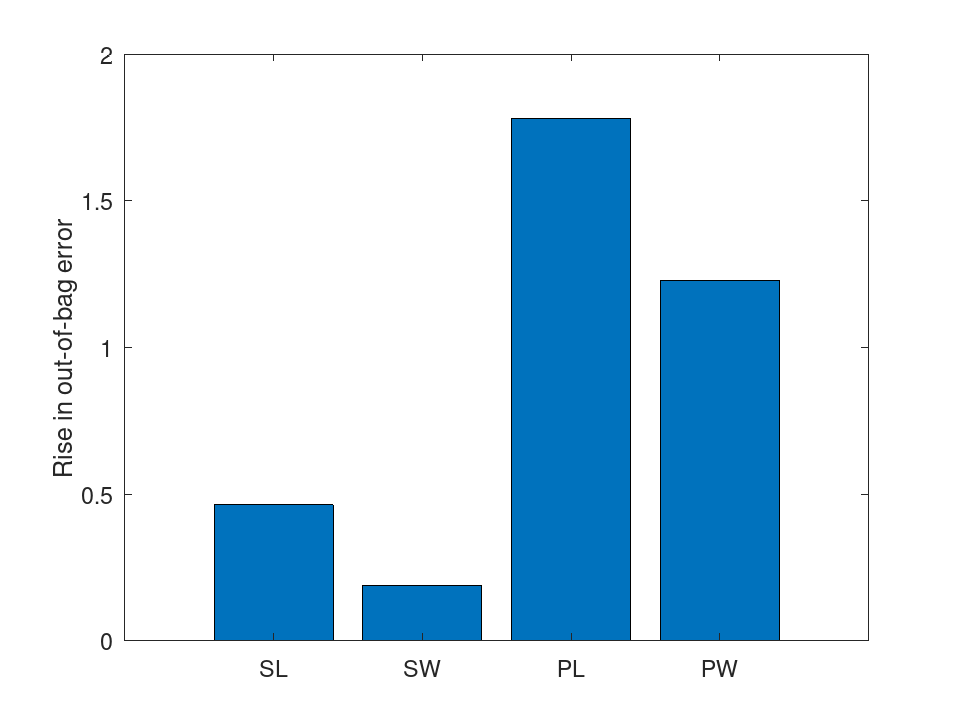
Scale the proximities of a random forest to two dimensions and draw the flowers one color per species.
load fisheriris rng (42); B = fillprox (TreeBagger (50, meas, species)); mdsprox (B, 'Colors', 'rgb');
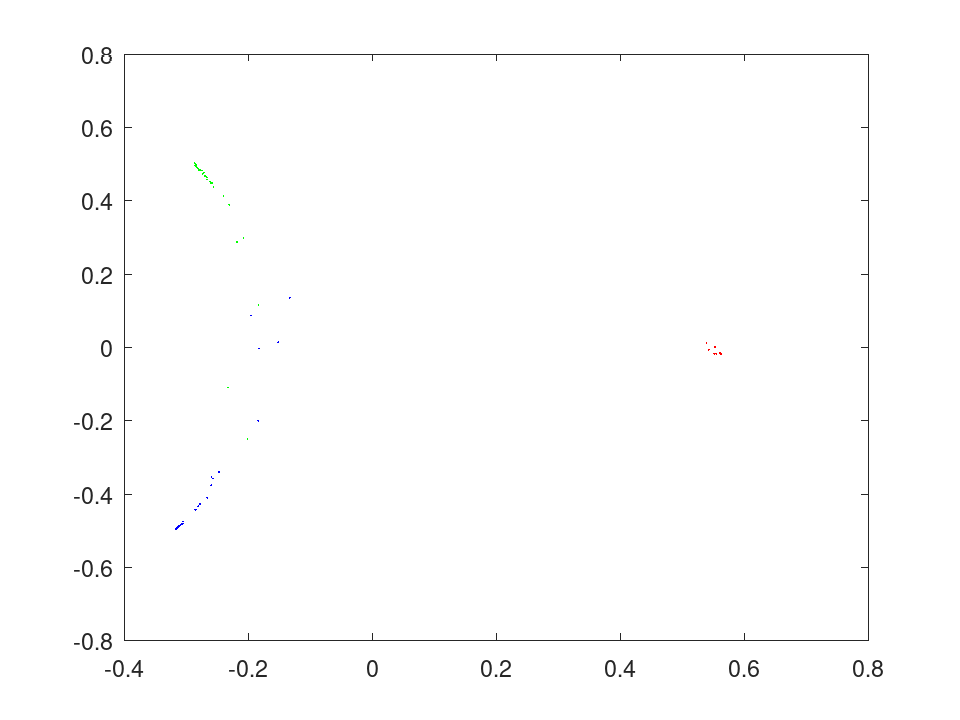
TreeBagger: err = error (obj, X, Y)
TreeBagger: err = error (…, name, value)
TreeBagger: err = error (obj, Tbl, ResponseVarName)
TreeBagger: err = error (obj, Tbl)
Behaves as CompactTreeBagger.error and takes the same Name-Value
arguments.
X may also be a table Tbl, whose variables are matched to
the predictors the model was fitted on by name and not by position.
error (obj, Tbl, ResponseVarName) takes the
response from the variable ResponseVarName names, and
error (obj, Tbl) from the variable the model was
fitted on. The response may also be given beside the table as
Y.
See also: TreeBagger, TreeBagger.oobError, CompactTreeBagger.error
Grow a random forest on the iris data, estimate its error from the observations each tree left out, and classify a new flower.
load fisheriris rng (42); B = TreeBagger (50, meas, species, 'OOBPrediction', 'on'); err = oobError (B); err(end)
ans = 0.053333
label = predict (B, [5.8, 2.8, 4.5, 1.4])
label =
1x1 cell array
{'versicolor'}
A regression forest predicting sepal length from the other three measurements, with the spread of its trees around each prediction.
load fisheriris rng (42); B = TreeBagger (50, meas(:,2:4), meas(:,1), 'Method', 'regression'); [yfit, sd] = predict (B, meas([1, 51, 101], 2:4))
yfit = 5.0382 6.5283 6.8350 sd = 0.1101 0.1816 0.3976
A 90% prediction interval for sepal length from the other three measurements, read off the quantiles of a regression forest.
load fisheriris
rng (42);
B = TreeBagger (100, meas(:,2:4), meas(:,1), 'Method', 'regression');
q = quantilePredict (B, meas([1, 51, 101], 2:4), ...
'Quantile', [0.05, 0.5, 0.95])
q = 4.6000 5.0463 5.5000 5.9000 6.5334 7.0853 6.2196 6.7508 7.7000
Which measurements a forest relies on: permuting a petal measurement among each tree's out-of-bag flowers raises the error the most.
load fisheriris
rng (42);
B = TreeBagger (50, meas, species, 'OOBPredictorImportance', 'on');
bar (B.OOBPermutedPredictorDeltaError);
set (gca, 'xticklabel', {'SL', 'SW', 'PL', 'PW'});
ylabel ('Rise in out-of-bag error');
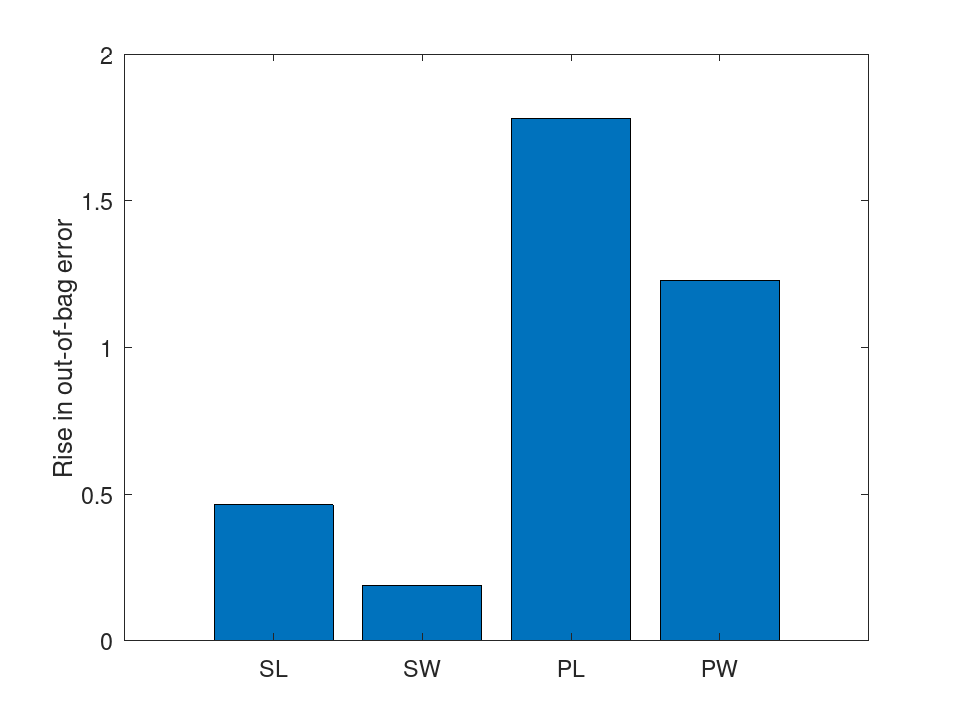
Scale the proximities of a random forest to two dimensions and draw the flowers one color per species.
load fisheriris rng (42); B = fillprox (TreeBagger (50, meas, species)); mdsprox (B, 'Colors', 'rgb');
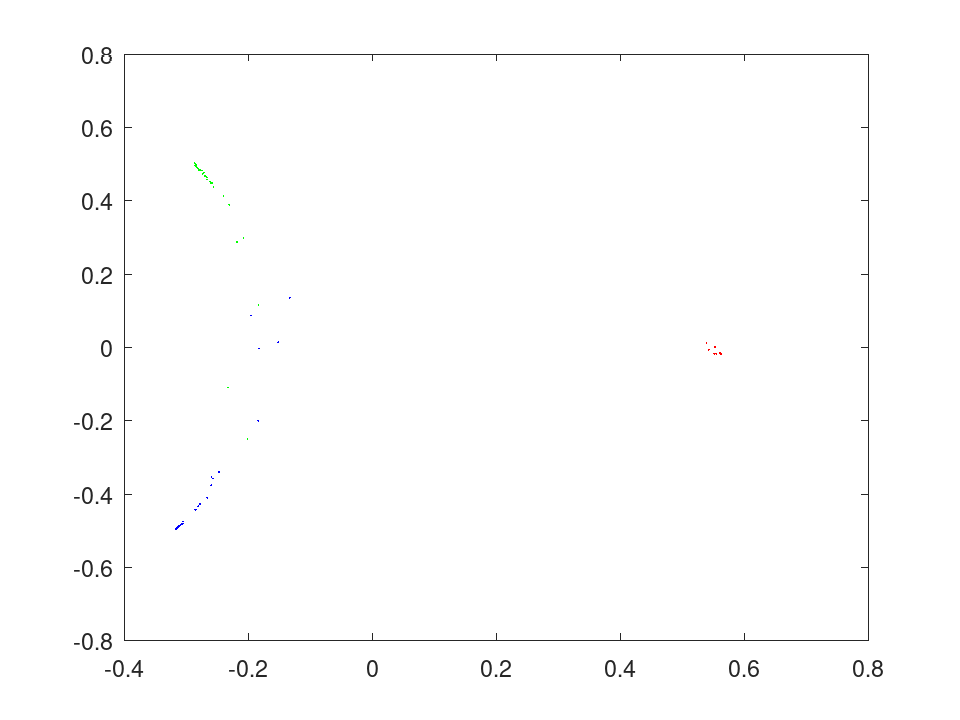
TreeBagger: err = oobError (obj)
TreeBagger: err = oobError (…, name, value)
The error of the out-of-bag predictions on the training data, weighted
by W. In 'individual' mode each tree is judged on its
own, the observations in its sample taking DefaultYfit, and
every observation counts in every mode, as MATLAB counts it.
'Mode', 'Trees', 'TreeWeights' and
'Weights' are taken as by CompactTreeBagger.error. The
ensemble must have been fitted with 'OOBPrediction' on.
See also: TreeBagger, TreeBagger.oobPredict, TreeBagger.oobMeanMargin
Grow a random forest on the iris data, estimate its error from the observations each tree left out, and classify a new flower.
load fisheriris rng (42); B = TreeBagger (50, meas, species, 'OOBPrediction', 'on'); err = oobError (B); err(end)
ans = 0.053333
label = predict (B, [5.8, 2.8, 4.5, 1.4])
label =
1x1 cell array
{'versicolor'}
A regression forest predicting sepal length from the other three measurements, with the spread of its trees around each prediction.
load fisheriris rng (42); B = TreeBagger (50, meas(:,2:4), meas(:,1), 'Method', 'regression'); [yfit, sd] = predict (B, meas([1, 51, 101], 2:4))
yfit = 5.0382 6.5283 6.8350 sd = 0.1101 0.1816 0.3976
A 90% prediction interval for sepal length from the other three measurements, read off the quantiles of a regression forest.
load fisheriris
rng (42);
B = TreeBagger (100, meas(:,2:4), meas(:,1), 'Method', 'regression');
q = quantilePredict (B, meas([1, 51, 101], 2:4), ...
'Quantile', [0.05, 0.5, 0.95])
q = 4.6000 5.0463 5.5000 5.9000 6.5334 7.0853 6.2196 6.7508 7.7000
Which measurements a forest relies on: permuting a petal measurement among each tree's out-of-bag flowers raises the error the most.
load fisheriris
rng (42);
B = TreeBagger (50, meas, species, 'OOBPredictorImportance', 'on');
bar (B.OOBPermutedPredictorDeltaError);
set (gca, 'xticklabel', {'SL', 'SW', 'PL', 'PW'});
ylabel ('Rise in out-of-bag error');
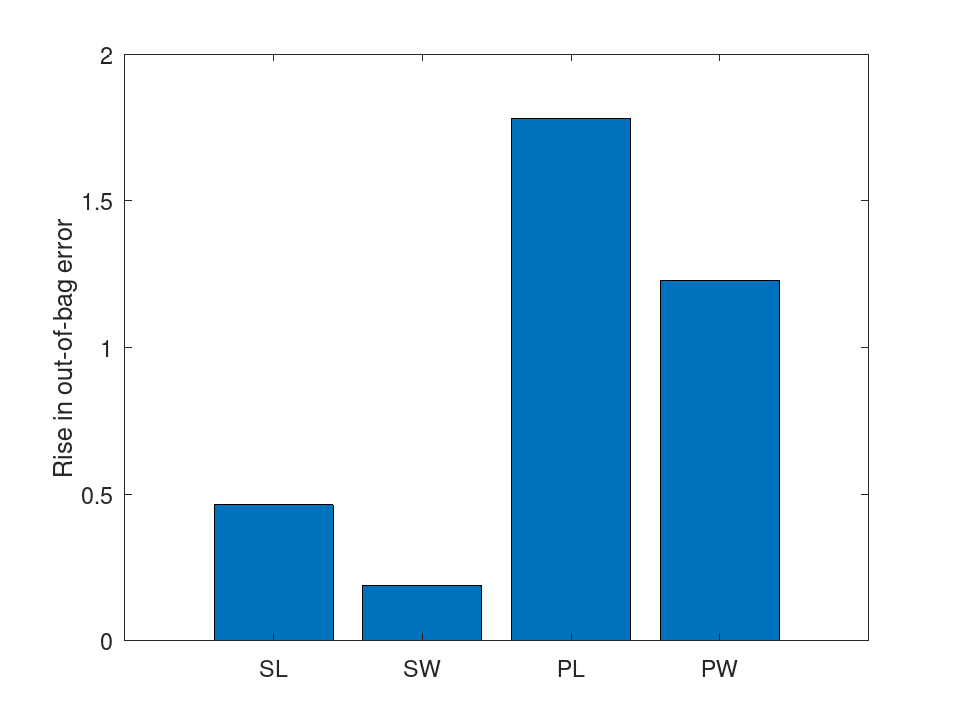
Scale the proximities of a random forest to two dimensions and draw the flowers one color per species.
load fisheriris rng (42); B = fillprox (TreeBagger (50, meas, species)); mdsprox (B, 'Colors', 'rgb');
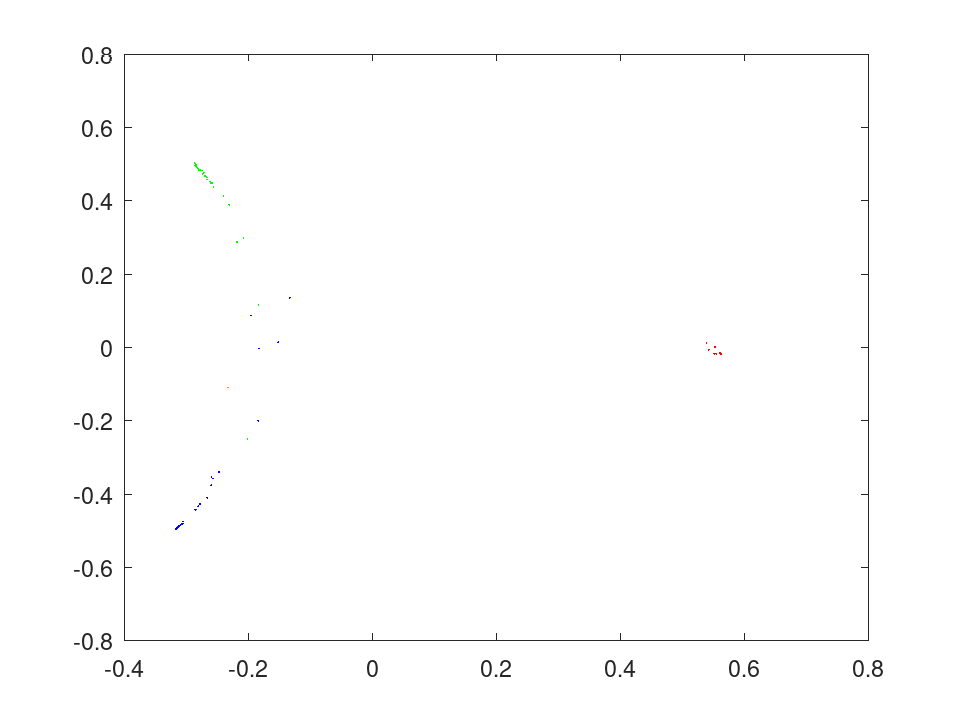
TreeBagger: m = margin (obj, X, Y)
TreeBagger: m = margin (…, name, value)
TreeBagger: m = margin (obj, Tbl, ResponseVarName)
TreeBagger: m = margin (obj, Tbl)
Behaves as CompactTreeBagger.margin and takes the same Name-Value
arguments.
X may also be a table Tbl, whose variables are matched to
the predictors the model was fitted on by name and not by position.
margin (obj, Tbl, ResponseVarName) takes the
response from the variable ResponseVarName names, and
margin (obj, Tbl) from the variable the model was
fitted on. The response may also be given beside the table as
Y.
See also: TreeBagger, TreeBagger.oobMargin, CompactTreeBagger.margin
Grow a random forest on the iris data, estimate its error from the observations each tree left out, and classify a new flower.
load fisheriris rng (42); B = TreeBagger (50, meas, species, 'OOBPrediction', 'on'); err = oobError (B); err(end)
ans = 0.053333
label = predict (B, [5.8, 2.8, 4.5, 1.4])
label =
1x1 cell array
{'versicolor'}
A regression forest predicting sepal length from the other three measurements, with the spread of its trees around each prediction.
load fisheriris rng (42); B = TreeBagger (50, meas(:,2:4), meas(:,1), 'Method', 'regression'); [yfit, sd] = predict (B, meas([1, 51, 101], 2:4))
yfit = 5.0382 6.5283 6.8350 sd = 0.1101 0.1816 0.3976
A 90% prediction interval for sepal length from the other three measurements, read off the quantiles of a regression forest.
load fisheriris
rng (42);
B = TreeBagger (100, meas(:,2:4), meas(:,1), 'Method', 'regression');
q = quantilePredict (B, meas([1, 51, 101], 2:4), ...
'Quantile', [0.05, 0.5, 0.95])
q = 4.6000 5.0463 5.5000 5.9000 6.5334 7.0853 6.2196 6.7508 7.7000
Which measurements a forest relies on: permuting a petal measurement among each tree's out-of-bag flowers raises the error the most.
load fisheriris
rng (42);
B = TreeBagger (50, meas, species, 'OOBPredictorImportance', 'on');
bar (B.OOBPermutedPredictorDeltaError);
set (gca, 'xticklabel', {'SL', 'SW', 'PL', 'PW'});
ylabel ('Rise in out-of-bag error');
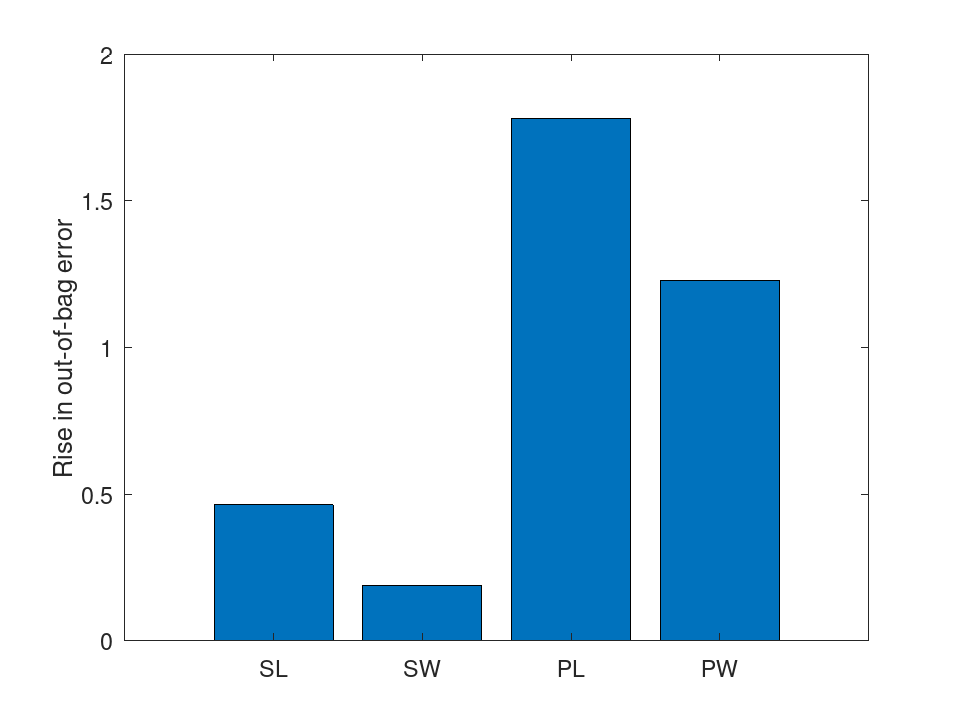
Scale the proximities of a random forest to two dimensions and draw the flowers one color per species.
load fisheriris rng (42); B = fillprox (TreeBagger (50, meas, species)); mdsprox (B, 'Colors', 'rgb');
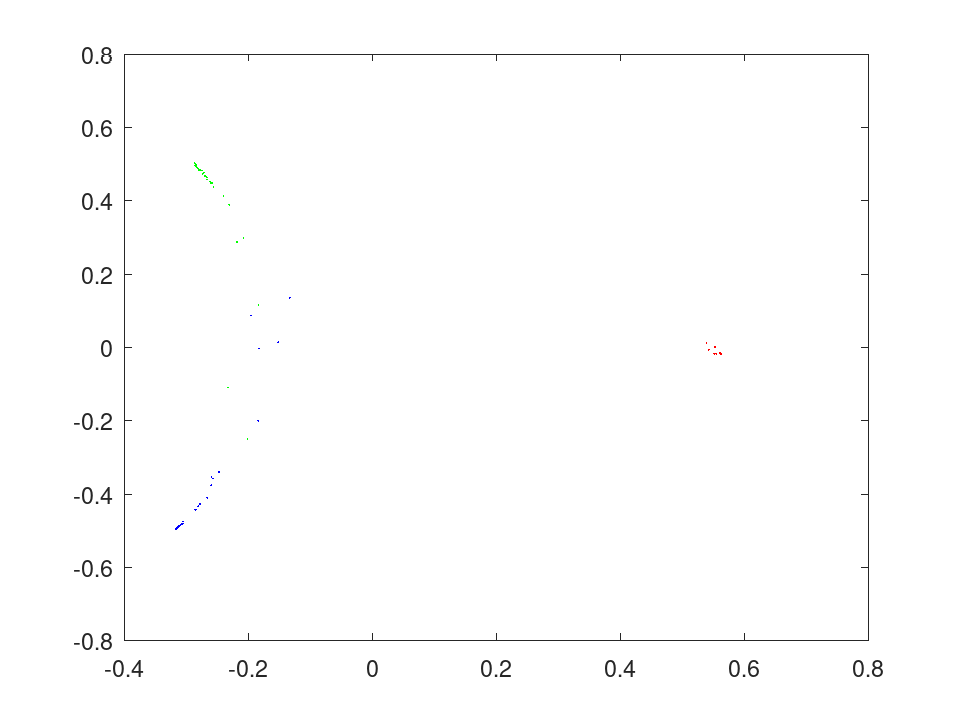
TreeBagger: m = oobMargin (obj)
TreeBagger: m = oobMargin (…, name, value)
The margins of the out-of-bag predictions, with 'Mode',
'Trees' and 'TreeWeights' taken as by
CompactTreeBagger.margin. The ensemble must have been fitted
with 'OOBPrediction' on.
See also: TreeBagger, TreeBagger.oobMeanMargin, TreeBagger.margin
Grow a random forest on the iris data, estimate its error from the observations each tree left out, and classify a new flower.
load fisheriris rng (42); B = TreeBagger (50, meas, species, 'OOBPrediction', 'on'); err = oobError (B); err(end)
ans = 0.053333
label = predict (B, [5.8, 2.8, 4.5, 1.4])
label =
1x1 cell array
{'versicolor'}
A regression forest predicting sepal length from the other three measurements, with the spread of its trees around each prediction.
load fisheriris rng (42); B = TreeBagger (50, meas(:,2:4), meas(:,1), 'Method', 'regression'); [yfit, sd] = predict (B, meas([1, 51, 101], 2:4))
yfit = 5.0382 6.5283 6.8350 sd = 0.1101 0.1816 0.3976
A 90% prediction interval for sepal length from the other three measurements, read off the quantiles of a regression forest.
load fisheriris
rng (42);
B = TreeBagger (100, meas(:,2:4), meas(:,1), 'Method', 'regression');
q = quantilePredict (B, meas([1, 51, 101], 2:4), ...
'Quantile', [0.05, 0.5, 0.95])
q = 4.6000 5.0463 5.5000 5.9000 6.5334 7.0853 6.2196 6.7508 7.7000
Which measurements a forest relies on: permuting a petal measurement among each tree's out-of-bag flowers raises the error the most.
load fisheriris
rng (42);
B = TreeBagger (50, meas, species, 'OOBPredictorImportance', 'on');
bar (B.OOBPermutedPredictorDeltaError);
set (gca, 'xticklabel', {'SL', 'SW', 'PL', 'PW'});
ylabel ('Rise in out-of-bag error');
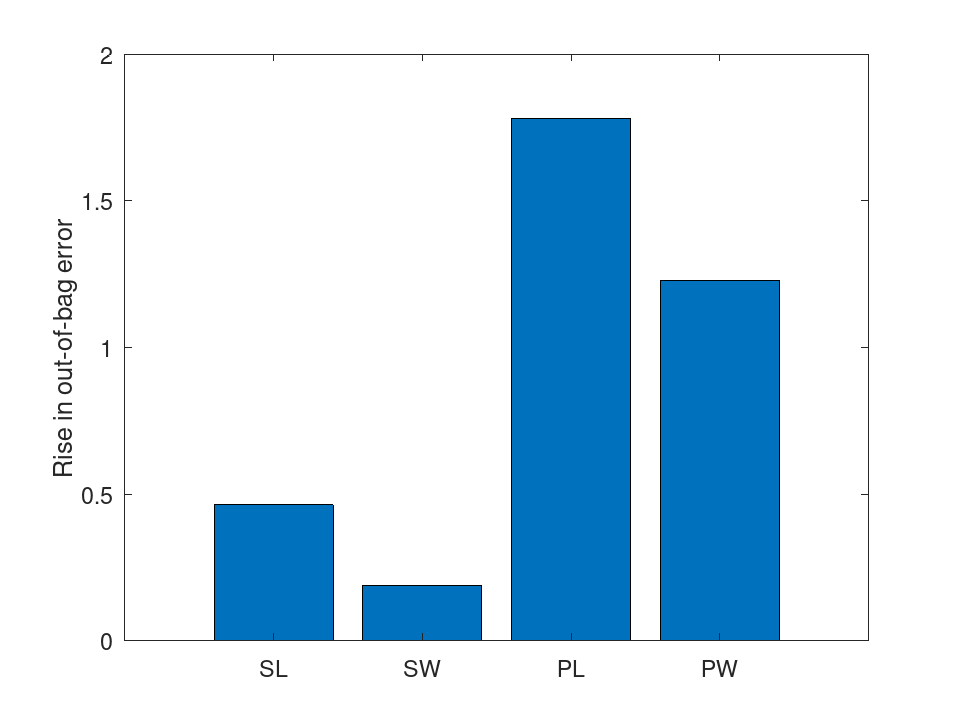
Scale the proximities of a random forest to two dimensions and draw the flowers one color per species.
load fisheriris rng (42); B = fillprox (TreeBagger (50, meas, species)); mdsprox (B, 'Colors', 'rgb');
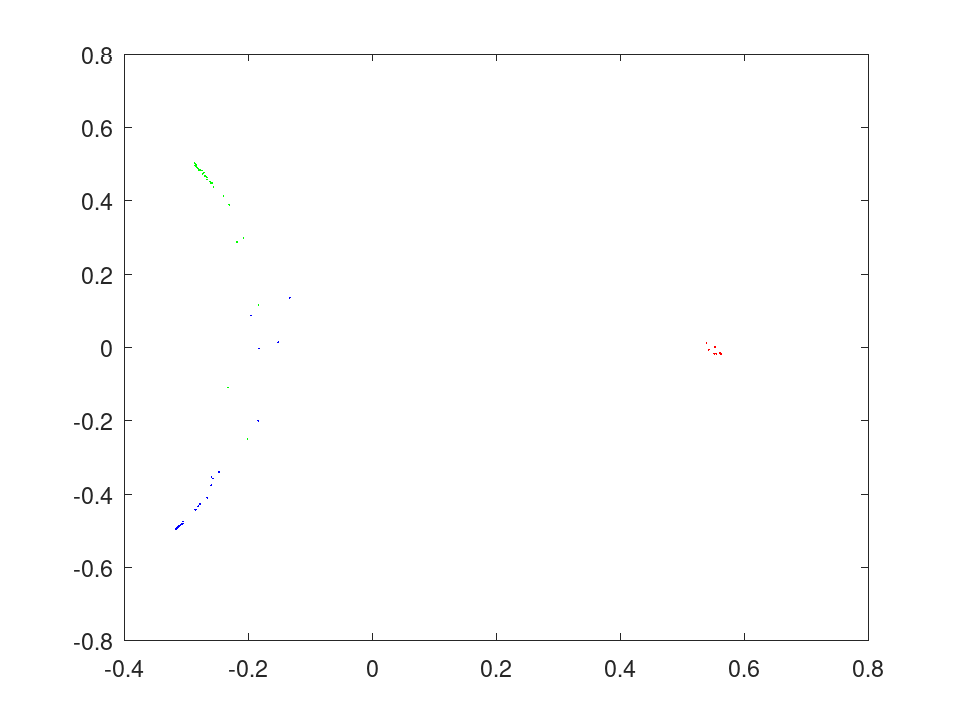
TreeBagger: mm = meanMargin (obj, X, Y)
TreeBagger: mm = meanMargin (…, name, value)
TreeBagger: mm = meanMargin (obj, Tbl, ResponseVarName)
TreeBagger: mm = meanMargin (obj, Tbl)
Behaves as CompactTreeBagger.meanMargin and takes the same
Name-Value arguments.
X may also be a table Tbl, whose variables are matched to
the predictors the model was fitted on by name and not by position.
meanMargin (obj, Tbl, ResponseVarName)
takes the response from the variable ResponseVarName names, and
meanMargin (obj, Tbl) from the variable the model
was fitted on. The response may also be given beside the table as
Y.
See also: TreeBagger, TreeBagger.oobMeanMargin, CompactTreeBagger.meanMargin
Grow a random forest on the iris data, estimate its error from the observations each tree left out, and classify a new flower.
load fisheriris rng (42); B = TreeBagger (50, meas, species, 'OOBPrediction', 'on'); err = oobError (B); err(end)
ans = 0.053333
label = predict (B, [5.8, 2.8, 4.5, 1.4])
label =
1x1 cell array
{'versicolor'}
A regression forest predicting sepal length from the other three measurements, with the spread of its trees around each prediction.
load fisheriris rng (42); B = TreeBagger (50, meas(:,2:4), meas(:,1), 'Method', 'regression'); [yfit, sd] = predict (B, meas([1, 51, 101], 2:4))
yfit = 5.0382 6.5283 6.8350 sd = 0.1101 0.1816 0.3976
A 90% prediction interval for sepal length from the other three measurements, read off the quantiles of a regression forest.
load fisheriris
rng (42);
B = TreeBagger (100, meas(:,2:4), meas(:,1), 'Method', 'regression');
q = quantilePredict (B, meas([1, 51, 101], 2:4), ...
'Quantile', [0.05, 0.5, 0.95])
q = 4.6000 5.0463 5.5000 5.9000 6.5334 7.0853 6.2196 6.7508 7.7000
Which measurements a forest relies on: permuting a petal measurement among each tree's out-of-bag flowers raises the error the most.
load fisheriris
rng (42);
B = TreeBagger (50, meas, species, 'OOBPredictorImportance', 'on');
bar (B.OOBPermutedPredictorDeltaError);
set (gca, 'xticklabel', {'SL', 'SW', 'PL', 'PW'});
ylabel ('Rise in out-of-bag error');
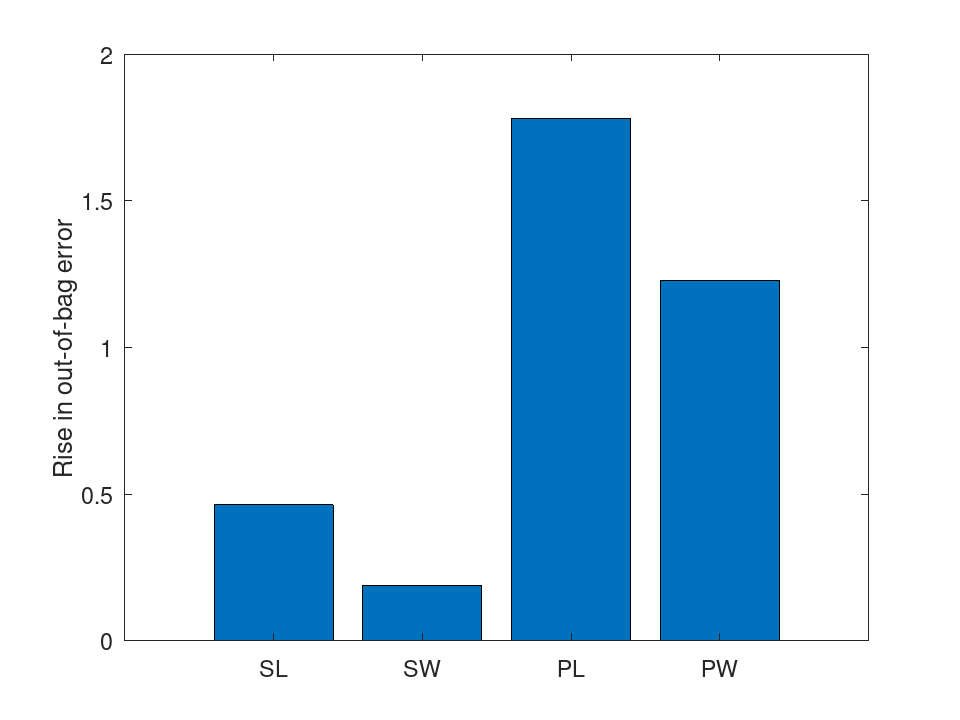
Scale the proximities of a random forest to two dimensions and draw the flowers one color per species.
load fisheriris rng (42); B = fillprox (TreeBagger (50, meas, species)); mdsprox (B, 'Colors', 'rgb');
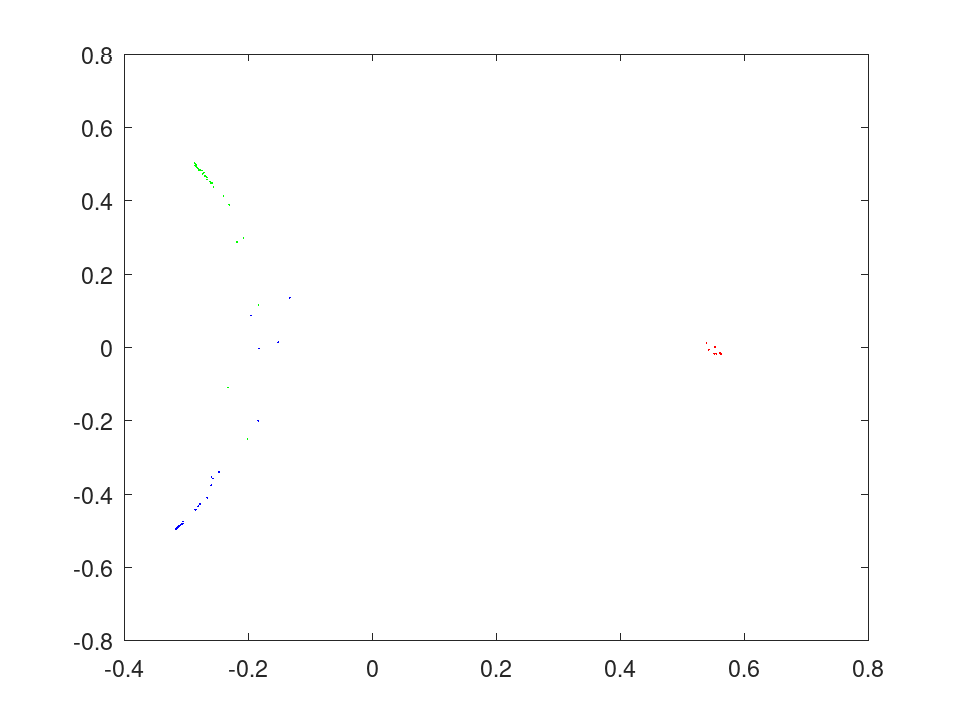
TreeBagger: mm = oobMeanMargin (obj)
TreeBagger: mm = oobMeanMargin (…, name, value)
The mean of TreeBagger.oobMargin, weighted by W unless
'Weights' are given. The ensemble must have been fitted with
'OOBPrediction' on.
See also: TreeBagger, TreeBagger.oobMargin, TreeBagger.oobError
Grow a random forest on the iris data, estimate its error from the observations each tree left out, and classify a new flower.
load fisheriris rng (42); B = TreeBagger (50, meas, species, 'OOBPrediction', 'on'); err = oobError (B); err(end)
ans = 0.053333
label = predict (B, [5.8, 2.8, 4.5, 1.4])
label =
1x1 cell array
{'versicolor'}
A regression forest predicting sepal length from the other three measurements, with the spread of its trees around each prediction.
load fisheriris rng (42); B = TreeBagger (50, meas(:,2:4), meas(:,1), 'Method', 'regression'); [yfit, sd] = predict (B, meas([1, 51, 101], 2:4))
yfit = 5.0382 6.5283 6.8350 sd = 0.1101 0.1816 0.3976
A 90% prediction interval for sepal length from the other three measurements, read off the quantiles of a regression forest.
load fisheriris
rng (42);
B = TreeBagger (100, meas(:,2:4), meas(:,1), 'Method', 'regression');
q = quantilePredict (B, meas([1, 51, 101], 2:4), ...
'Quantile', [0.05, 0.5, 0.95])
q = 4.6000 5.0463 5.5000 5.9000 6.5334 7.0853 6.2196 6.7508 7.7000
Which measurements a forest relies on: permuting a petal measurement among each tree's out-of-bag flowers raises the error the most.
load fisheriris
rng (42);
B = TreeBagger (50, meas, species, 'OOBPredictorImportance', 'on');
bar (B.OOBPermutedPredictorDeltaError);
set (gca, 'xticklabel', {'SL', 'SW', 'PL', 'PW'});
ylabel ('Rise in out-of-bag error');
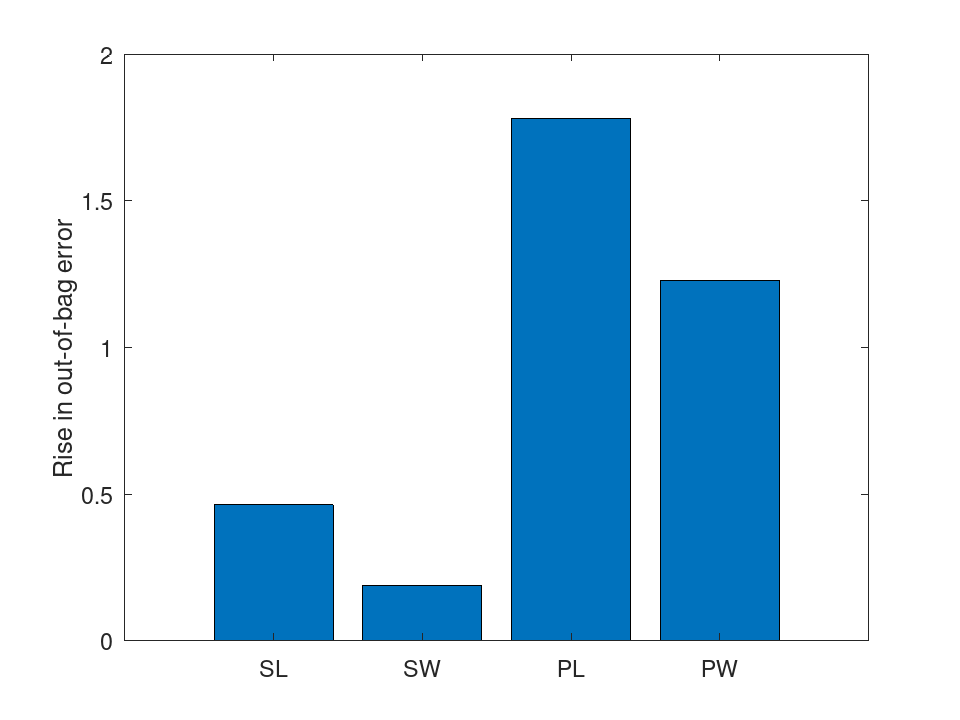
Scale the proximities of a random forest to two dimensions and draw the flowers one color per species.
load fisheriris rng (42); B = fillprox (TreeBagger (50, meas, species)); mdsprox (B, 'Colors', 'rgb');
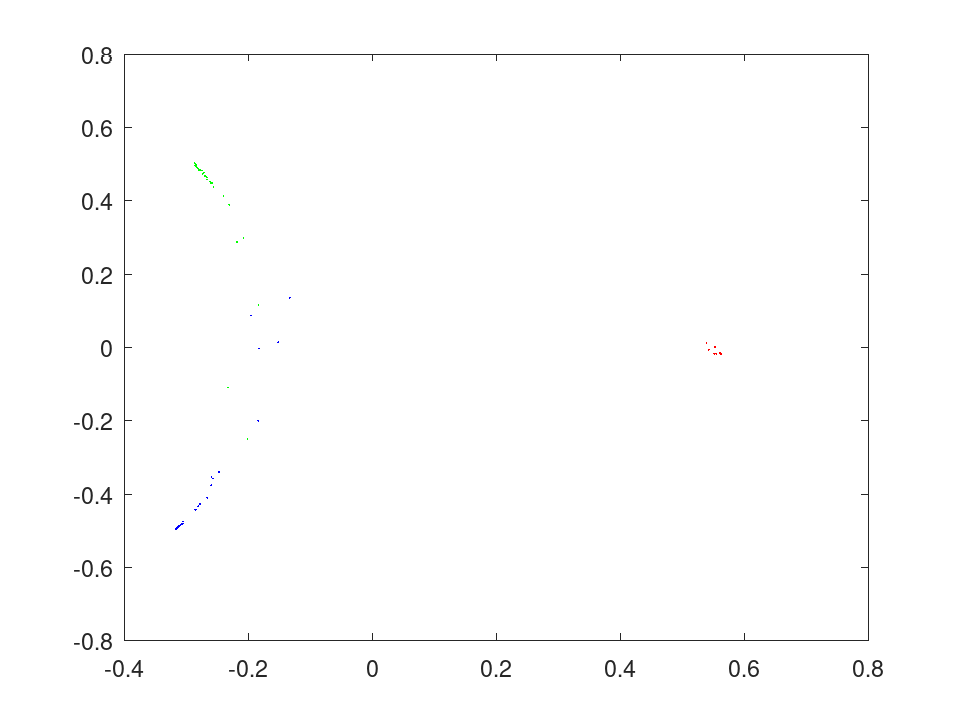
TreeBagger: YFit = quantilePredict (obj, X)
TreeBagger: [YFit, YW] = quantilePredict (…)
TreeBagger: … = quantilePredict (…, name, value)
Each tree gives every training observation a weight for each row of X: the number of times the tree’s sample holds the observation, divided by the size of the leaf the row comes to rest at, when the observation is in that leaf, and zero otherwise. The weights are averaged over the trees, with their tree weights, into YW, a sparse NxM matrix with one row per training observation and one column per row of X, each column summing to one.
YFit is an MxQ matrix holding, for each row of X and
each quantile probability, the quantile of the training responses under
those weights. The responses are sorted, each keeping its own weight,
and the quantile is interpolated linearly between them at their
cumulative weights less half their own weight, taking the smallest or
the largest response beyond either end. A row no tree may answer for
takes quantile (obj.Y, tau), and its column of
YW weighs every training observation equally. The observation
weights enter only through the samples they drew.
Name-Value arguments:
| Name | Value | |
|---|---|---|
'Quantile' | A vector of probabilities tau between 0 and 1. The default is 0.5, the median. | |
'Trees' | 'all' (default) or a vector of
indices of the trees to use. | |
'TreeWeights' | A nonnegative vector with one weight per tree used. The default weighs them equally. | |
'UseInstanceForTree' | An MxNumTrees logical matrix saying which tree may answer for which row. |
X may also be a table, whose variables are matched to the predictors the model was fitted on by name and not by position: one the model was not fitted on is passed over, one it needs and cannot find is named, and a value holding a level is coded as that level was coded at fitting.
See also: TreeBagger, TreeBagger.oobQuantilePredict, TreeBagger.quantileError, TreeBagger.predict
Grow a random forest on the iris data, estimate its error from the observations each tree left out, and classify a new flower.
load fisheriris rng (42); B = TreeBagger (50, meas, species, 'OOBPrediction', 'on'); err = oobError (B); err(end)
ans = 0.053333
label = predict (B, [5.8, 2.8, 4.5, 1.4])
label =
1x1 cell array
{'versicolor'}
A regression forest predicting sepal length from the other three measurements, with the spread of its trees around each prediction.
load fisheriris rng (42); B = TreeBagger (50, meas(:,2:4), meas(:,1), 'Method', 'regression'); [yfit, sd] = predict (B, meas([1, 51, 101], 2:4))
yfit = 5.0382 6.5283 6.8350 sd = 0.1101 0.1816 0.3976
A 90% prediction interval for sepal length from the other three measurements, read off the quantiles of a regression forest.
load fisheriris
rng (42);
B = TreeBagger (100, meas(:,2:4), meas(:,1), 'Method', 'regression');
q = quantilePredict (B, meas([1, 51, 101], 2:4), ...
'Quantile', [0.05, 0.5, 0.95])
q = 4.6000 5.0463 5.5000 5.9000 6.5334 7.0853 6.2196 6.7508 7.7000
Which measurements a forest relies on: permuting a petal measurement among each tree's out-of-bag flowers raises the error the most.
load fisheriris
rng (42);
B = TreeBagger (50, meas, species, 'OOBPredictorImportance', 'on');
bar (B.OOBPermutedPredictorDeltaError);
set (gca, 'xticklabel', {'SL', 'SW', 'PL', 'PW'});
ylabel ('Rise in out-of-bag error');
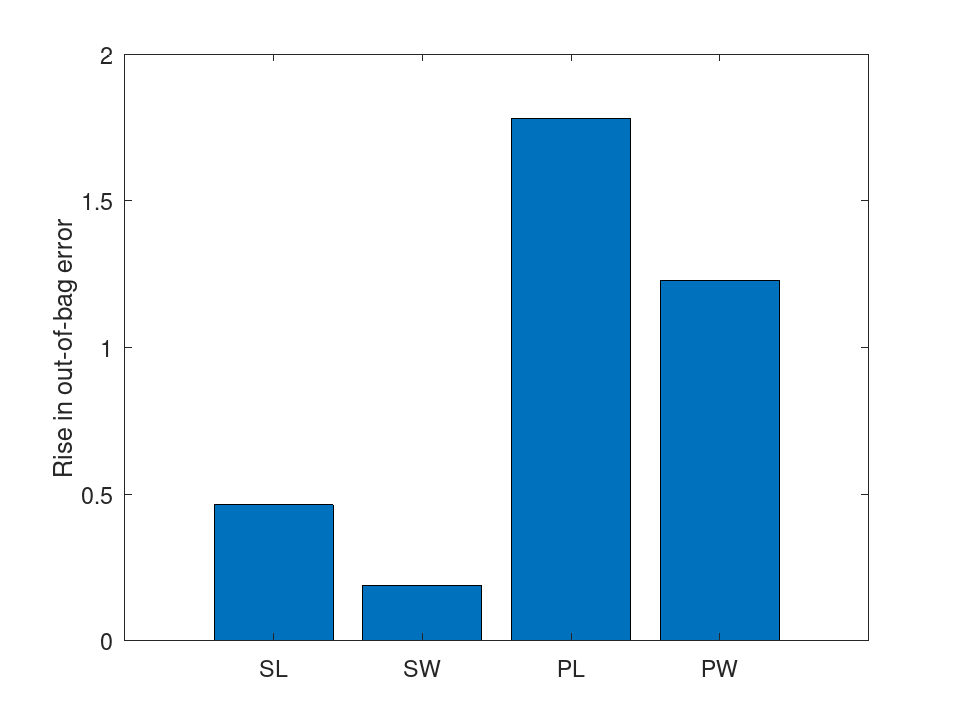
Scale the proximities of a random forest to two dimensions and draw the flowers one color per species.
load fisheriris rng (42); B = fillprox (TreeBagger (50, meas, species)); mdsprox (B, 'Colors', 'rgb');
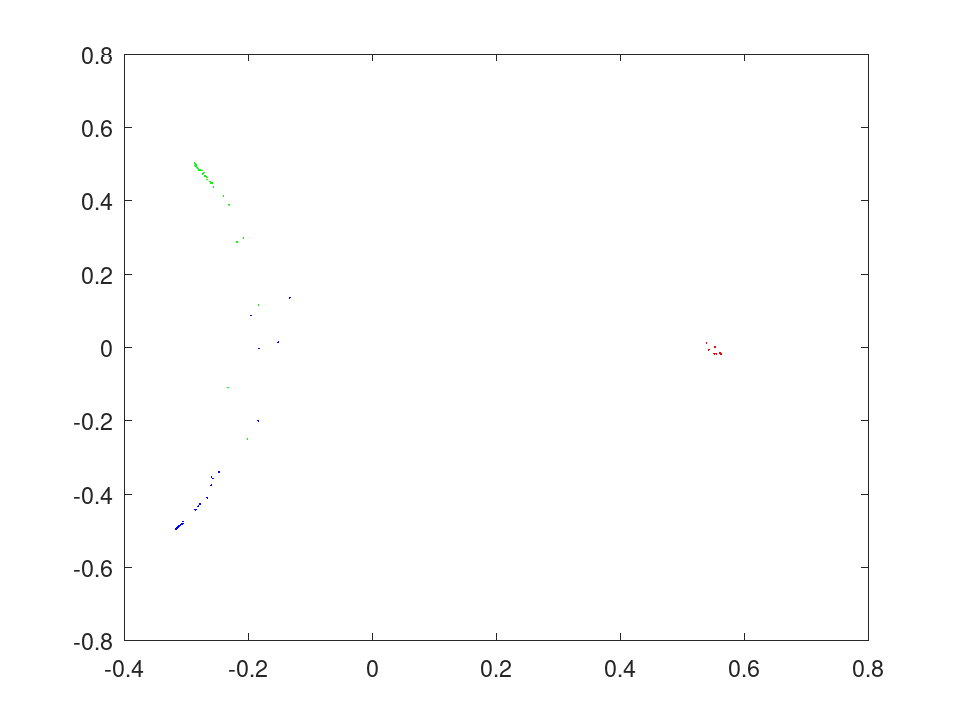
TreeBagger: YFit = oobQuantilePredict (obj)
TreeBagger: [YFit, YW] = oobQuantilePredict (…)
TreeBagger: … = oobQuantilePredict (…, name, value)
Each training observation is predicted as by
TreeBagger.quantilePredict, by the trees whose samples left it
out. An observation in the sample of every tree used takes
quantile (obj.Y, tau). YW is NxN.
'Quantile', 'Trees' and 'TreeWeights' are taken
as by TreeBagger.quantilePredict. The ensemble must have been
fitted with 'OOBPrediction' on.
See also: TreeBagger, TreeBagger.quantilePredict, TreeBagger.oobQuantileError
Grow a random forest on the iris data, estimate its error from the observations each tree left out, and classify a new flower.
load fisheriris rng (42); B = TreeBagger (50, meas, species, 'OOBPrediction', 'on'); err = oobError (B); err(end)
ans = 0.053333
label = predict (B, [5.8, 2.8, 4.5, 1.4])
label =
1x1 cell array
{'versicolor'}
A regression forest predicting sepal length from the other three measurements, with the spread of its trees around each prediction.
load fisheriris rng (42); B = TreeBagger (50, meas(:,2:4), meas(:,1), 'Method', 'regression'); [yfit, sd] = predict (B, meas([1, 51, 101], 2:4))
yfit = 5.0382 6.5283 6.8350 sd = 0.1101 0.1816 0.3976
A 90% prediction interval for sepal length from the other three measurements, read off the quantiles of a regression forest.
load fisheriris
rng (42);
B = TreeBagger (100, meas(:,2:4), meas(:,1), 'Method', 'regression');
q = quantilePredict (B, meas([1, 51, 101], 2:4), ...
'Quantile', [0.05, 0.5, 0.95])
q = 4.6000 5.0463 5.5000 5.9000 6.5334 7.0853 6.2196 6.7508 7.7000
Which measurements a forest relies on: permuting a petal measurement among each tree's out-of-bag flowers raises the error the most.
load fisheriris
rng (42);
B = TreeBagger (50, meas, species, 'OOBPredictorImportance', 'on');
bar (B.OOBPermutedPredictorDeltaError);
set (gca, 'xticklabel', {'SL', 'SW', 'PL', 'PW'});
ylabel ('Rise in out-of-bag error');
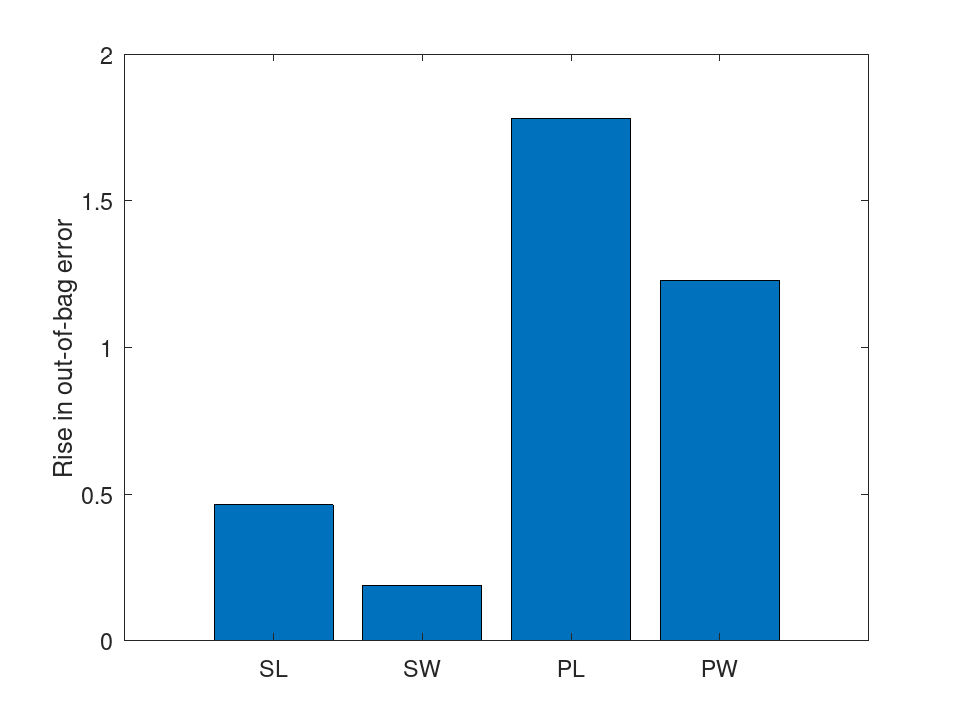
Scale the proximities of a random forest to two dimensions and draw the flowers one color per species.
load fisheriris rng (42); B = fillprox (TreeBagger (50, meas, species)); mdsprox (B, 'Colors', 'rgb');
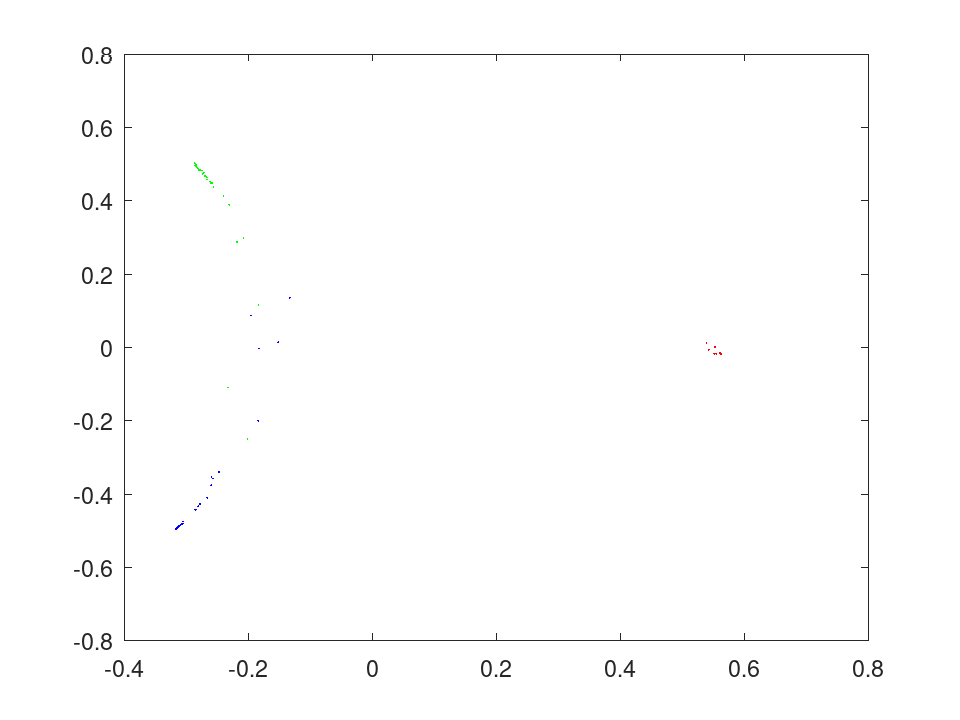
TreeBagger: err = quantileError (obj, X, Y)
TreeBagger: err = quantileError (…, name, value)
TreeBagger: err = quantileError (obj, Tbl, ResponseVarName)
TreeBagger: err = quantileError (obj, Tbl)
For each quantile probability tau, err is the weighted
mean over the observations of the pinball loss, tau (y - q)
where the response y is not below the predicted quantile
q and (1 - tau) (q - y) where it is. The quantiles are
predicted as by TreeBagger.quantilePredict.
In 'ensemble' mode, the default, err is a row with one
element per quantile. In 'cumulative' mode it has one row per
tree, the loss of the first tree, then of the first two, and so on, and
in 'individual' mode one row per tree, each on its own.
Name-Value arguments:
| Name | Value | |
|---|---|---|
'Mode' | 'ensemble' (default),
'cumulative' or 'individual'. | |
'Quantile' | A vector of probabilities between 0 and 1. The default is 0.5. | |
'Weights' | A nonnegative vector with one weight per observation. The default is uniform. |
'Trees', 'TreeWeights' and 'UseInstanceForTree'
are taken as by TreeBagger.quantilePredict, and
'TreeWeights' may not be given in 'individual' mode.
X may also be a table Tbl, whose variables are matched to
the predictors the model was fitted on by name and not by position.
quantileError (obj, Tbl, ResponseVarName)
takes the response from the variable ResponseVarName names, and
quantileError (obj, Tbl) from the variable the model
was fitted on. The response may also be given beside the table as
Y.
See also: TreeBagger, TreeBagger.quantilePredict, TreeBagger.oobQuantileError, TreeBagger.error
Grow a random forest on the iris data, estimate its error from the observations each tree left out, and classify a new flower.
load fisheriris rng (42); B = TreeBagger (50, meas, species, 'OOBPrediction', 'on'); err = oobError (B); err(end)
ans = 0.053333
label = predict (B, [5.8, 2.8, 4.5, 1.4])
label =
1x1 cell array
{'versicolor'}
A regression forest predicting sepal length from the other three measurements, with the spread of its trees around each prediction.
load fisheriris rng (42); B = TreeBagger (50, meas(:,2:4), meas(:,1), 'Method', 'regression'); [yfit, sd] = predict (B, meas([1, 51, 101], 2:4))
yfit = 5.0382 6.5283 6.8350 sd = 0.1101 0.1816 0.3976
A 90% prediction interval for sepal length from the other three measurements, read off the quantiles of a regression forest.
load fisheriris
rng (42);
B = TreeBagger (100, meas(:,2:4), meas(:,1), 'Method', 'regression');
q = quantilePredict (B, meas([1, 51, 101], 2:4), ...
'Quantile', [0.05, 0.5, 0.95])
q = 4.6000 5.0463 5.5000 5.9000 6.5334 7.0853 6.2196 6.7508 7.7000
Which measurements a forest relies on: permuting a petal measurement among each tree's out-of-bag flowers raises the error the most.
load fisheriris
rng (42);
B = TreeBagger (50, meas, species, 'OOBPredictorImportance', 'on');
bar (B.OOBPermutedPredictorDeltaError);
set (gca, 'xticklabel', {'SL', 'SW', 'PL', 'PW'});
ylabel ('Rise in out-of-bag error');
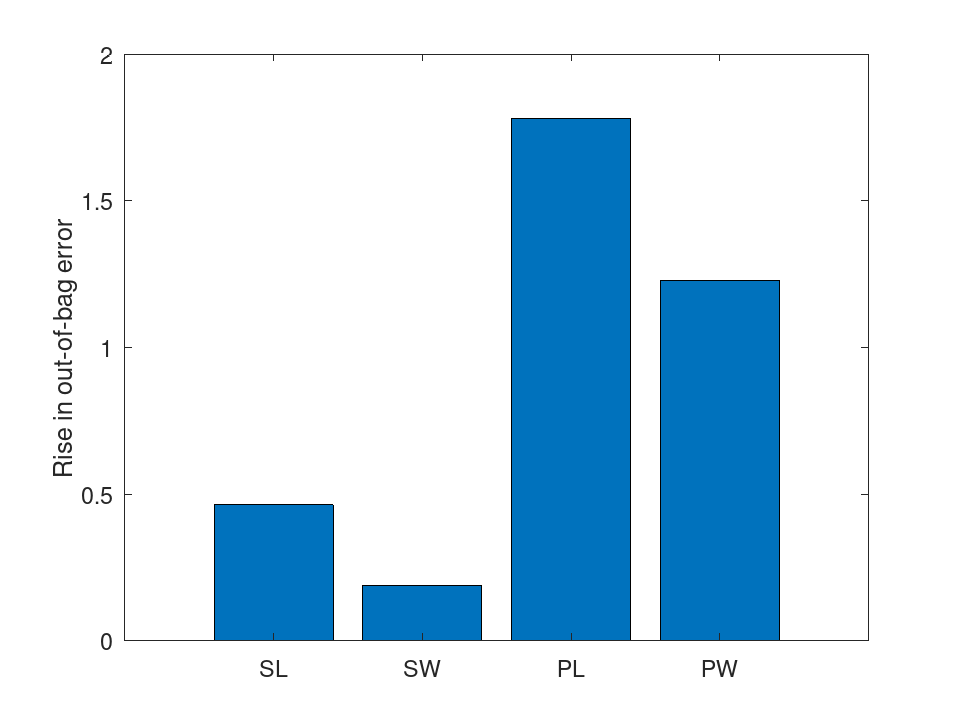
Scale the proximities of a random forest to two dimensions and draw the flowers one color per species.
load fisheriris rng (42); B = fillprox (TreeBagger (50, meas, species)); mdsprox (B, 'Colors', 'rgb');
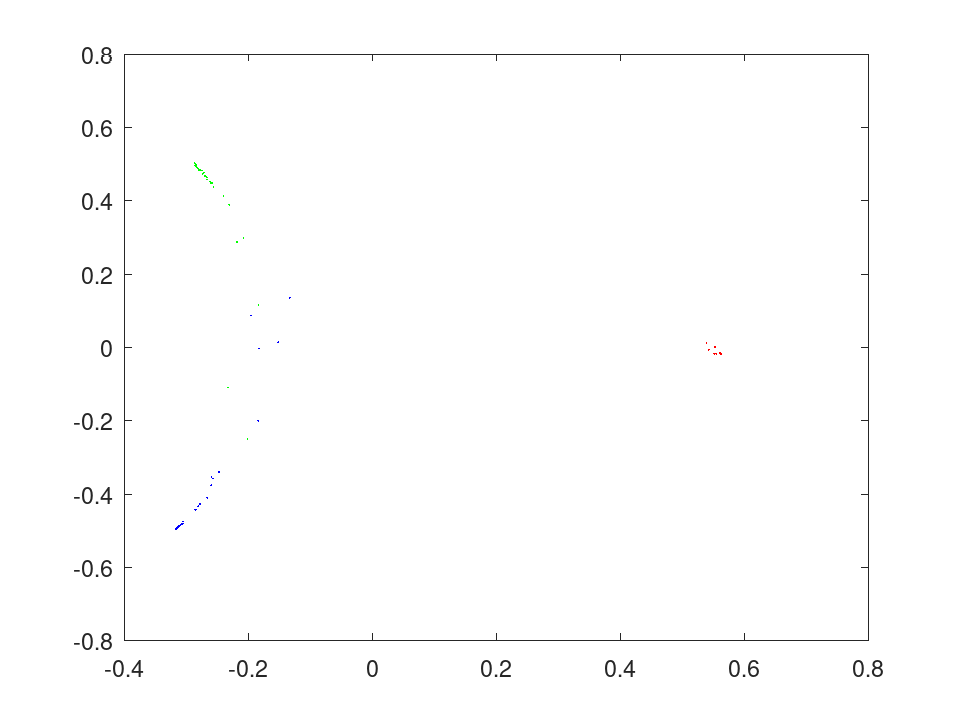
TreeBagger: err = oobQuantileError (obj)
TreeBagger: err = oobQuantileError (…, name, value)
The loss of TreeBagger.quantileError on the training data, the
quantiles predicted out of bag as by
TreeBagger.oobQuantilePredict and the observations weighted by
W. 'Mode', 'Quantile', 'Trees' and
'TreeWeights' are taken as by TreeBagger.quantileError.
The ensemble must have been fitted with 'OOBPrediction' on.
In 'individual' mode each tree is judged on the observations
out of its own bag alone, and a tree that left nothing out has a
NaN loss. MATLAB R2024a fails with an indexing error in that
mode.
See also: TreeBagger, TreeBagger.oobQuantilePredict, TreeBagger.quantileError, TreeBagger.oobError
Grow a random forest on the iris data, estimate its error from the observations each tree left out, and classify a new flower.
load fisheriris rng (42); B = TreeBagger (50, meas, species, 'OOBPrediction', 'on'); err = oobError (B); err(end)
ans = 0.053333
label = predict (B, [5.8, 2.8, 4.5, 1.4])
label =
1x1 cell array
{'versicolor'}
A regression forest predicting sepal length from the other three measurements, with the spread of its trees around each prediction.
load fisheriris rng (42); B = TreeBagger (50, meas(:,2:4), meas(:,1), 'Method', 'regression'); [yfit, sd] = predict (B, meas([1, 51, 101], 2:4))
yfit = 5.0382 6.5283 6.8350 sd = 0.1101 0.1816 0.3976
A 90% prediction interval for sepal length from the other three measurements, read off the quantiles of a regression forest.
load fisheriris
rng (42);
B = TreeBagger (100, meas(:,2:4), meas(:,1), 'Method', 'regression');
q = quantilePredict (B, meas([1, 51, 101], 2:4), ...
'Quantile', [0.05, 0.5, 0.95])
q = 4.6000 5.0463 5.5000 5.9000 6.5334 7.0853 6.2196 6.7508 7.7000
Which measurements a forest relies on: permuting a petal measurement among each tree's out-of-bag flowers raises the error the most.
load fisheriris
rng (42);
B = TreeBagger (50, meas, species, 'OOBPredictorImportance', 'on');
bar (B.OOBPermutedPredictorDeltaError);
set (gca, 'xticklabel', {'SL', 'SW', 'PL', 'PW'});
ylabel ('Rise in out-of-bag error');
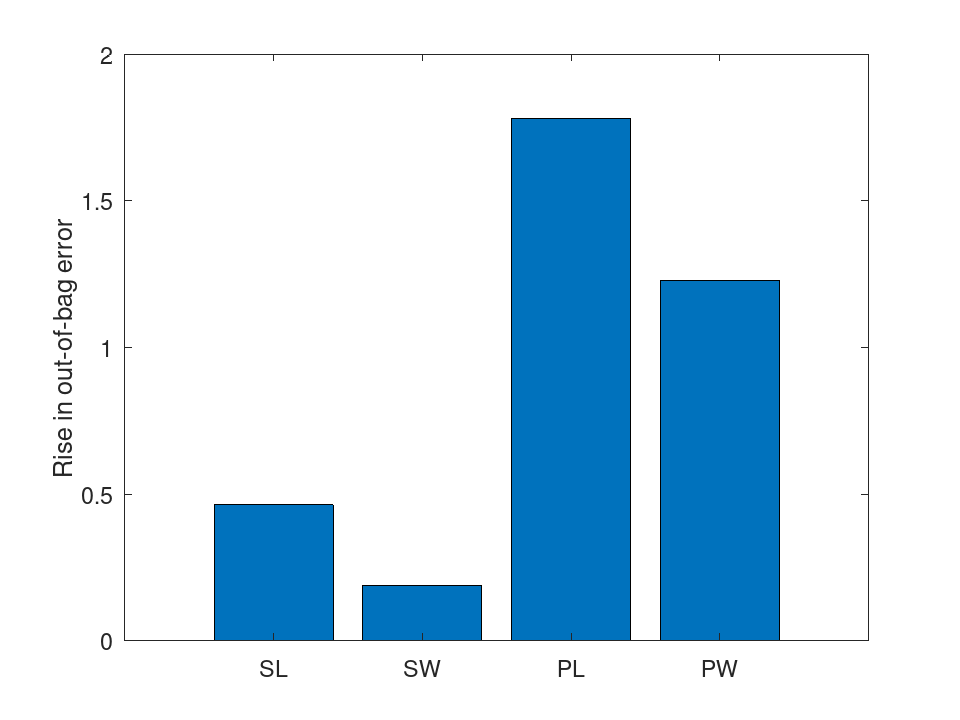
Scale the proximities of a random forest to two dimensions and draw the flowers one color per species.
load fisheriris rng (42); B = fillprox (TreeBagger (50, meas, species)); mdsprox (B, 'Colors', 'rgb');
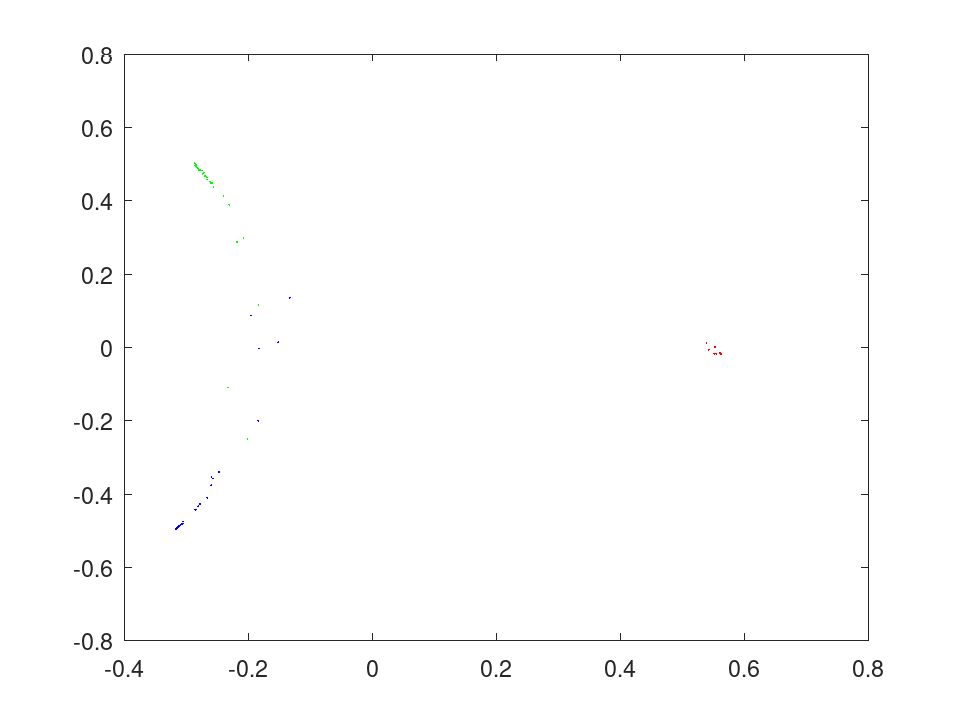
TreeBagger: B = fillprox (obj)
TreeBagger: B = fillprox (…, name, value)
B is the ensemble with Proximity holding the share of the
trees that bring each pair of training observations to the same leaf,
and OutlierMeasure the outlier measure computed from it.
'Trees' is 'all' (default) or a vector of indices of
the trees to use. 'NumPrint' is a nonnegative integer; after
every that many trees a line saying how many are done is printed.
See also: TreeBagger, TreeBagger.mdsprox, CompactTreeBagger.proximity, CompactTreeBagger.outlierMeasure
Grow a random forest on the iris data, estimate its error from the observations each tree left out, and classify a new flower.
load fisheriris rng (42); B = TreeBagger (50, meas, species, 'OOBPrediction', 'on'); err = oobError (B); err(end)
ans = 0.053333
label = predict (B, [5.8, 2.8, 4.5, 1.4])
label =
1x1 cell array
{'versicolor'}
A regression forest predicting sepal length from the other three measurements, with the spread of its trees around each prediction.
load fisheriris rng (42); B = TreeBagger (50, meas(:,2:4), meas(:,1), 'Method', 'regression'); [yfit, sd] = predict (B, meas([1, 51, 101], 2:4))
yfit = 5.0382 6.5283 6.8350 sd = 0.1101 0.1816 0.3976
A 90% prediction interval for sepal length from the other three measurements, read off the quantiles of a regression forest.
load fisheriris
rng (42);
B = TreeBagger (100, meas(:,2:4), meas(:,1), 'Method', 'regression');
q = quantilePredict (B, meas([1, 51, 101], 2:4), ...
'Quantile', [0.05, 0.5, 0.95])
q = 4.6000 5.0463 5.5000 5.9000 6.5334 7.0853 6.2196 6.7508 7.7000
Which measurements a forest relies on: permuting a petal measurement among each tree's out-of-bag flowers raises the error the most.
load fisheriris
rng (42);
B = TreeBagger (50, meas, species, 'OOBPredictorImportance', 'on');
bar (B.OOBPermutedPredictorDeltaError);
set (gca, 'xticklabel', {'SL', 'SW', 'PL', 'PW'});
ylabel ('Rise in out-of-bag error');
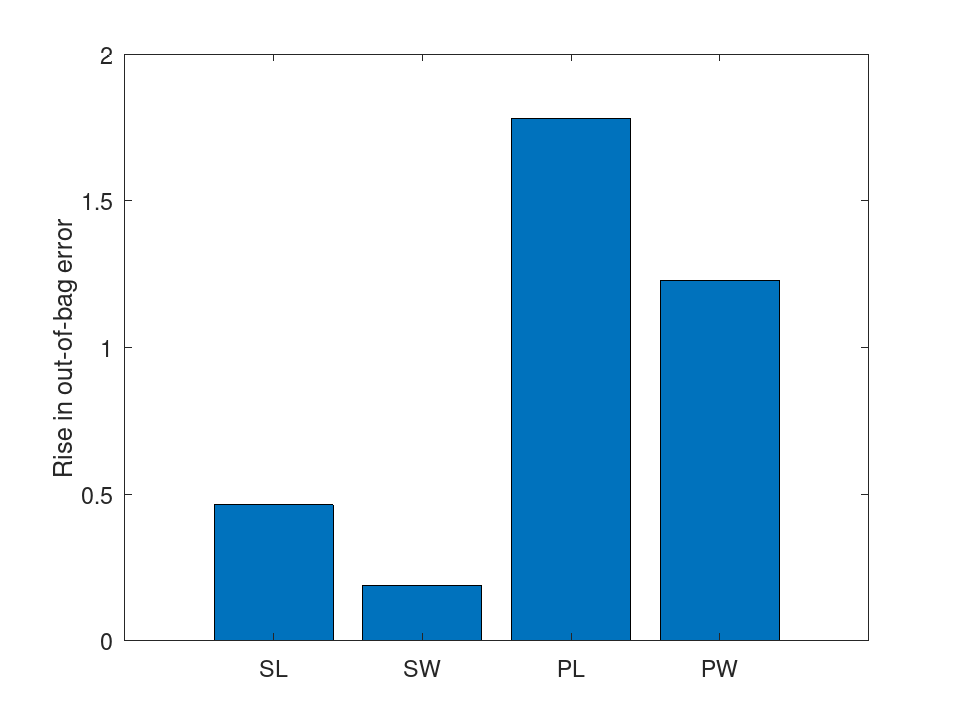
Scale the proximities of a random forest to two dimensions and draw the flowers one color per species.
load fisheriris rng (42); B = fillprox (TreeBagger (50, meas, species)); mdsprox (B, 'Colors', 'rgb');
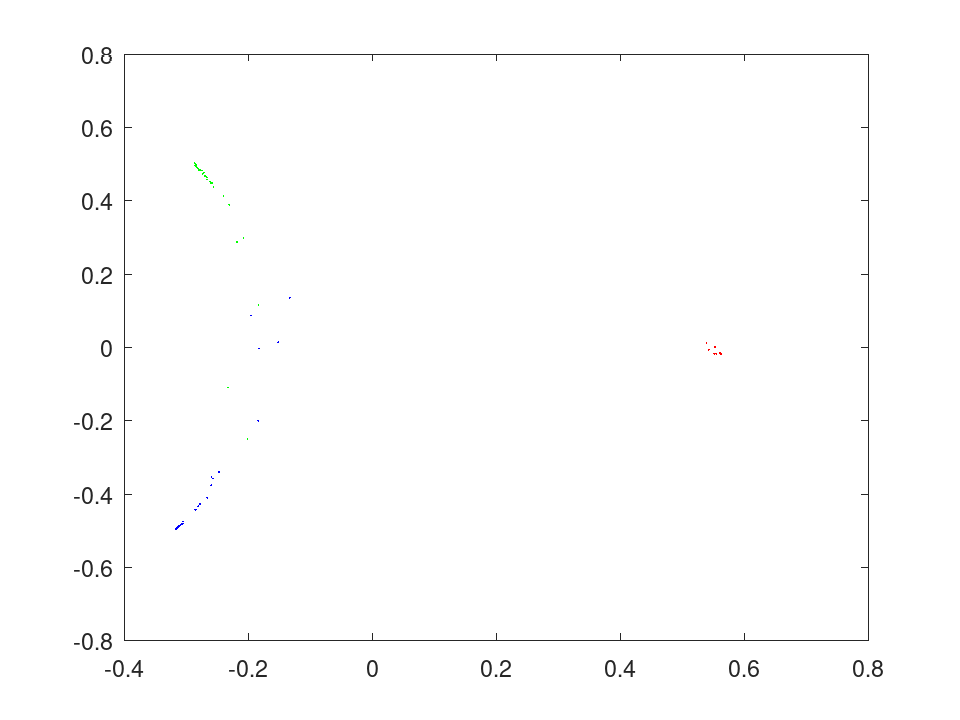
TreeBagger: [S, E] = mdsprox (obj)
TreeBagger: [S, E] = mdsprox (…, name, value)
Applies classical multidimensional scaling, as cmdscale does, to
the distances 1 - Proximity. S holds the scaled
coordinates, one column per positive eigenvalue, and E the
eigenvalues. fillprox must have filled Proximity first.
Name-Value arguments:
| Name | Value | |
|---|---|---|
'Keep' | 'all' (default), or a vector of
indices or a logical vector selecting the training observations to
scale. | |
'Colors' | A character vector with one color letter per class. When given, the scaled coordinates are drawn as overlaid scatter plots, one per class, a class beyond the number of letters not drawn; a regression ensemble is drawn in the first color. | |
'MDSCoordinates' | Two or three indices of the
columns of S to draw. The default is [1, 2]. They must
not exceed the number of columns of S even when nothing is drawn,
as in MATLAB, whose documentation says otherwise. |
See also: TreeBagger, TreeBagger.fillprox, CompactTreeBagger.mdsprox, cmdscale
Grow a random forest on the iris data, estimate its error from the observations each tree left out, and classify a new flower.
load fisheriris rng (42); B = TreeBagger (50, meas, species, 'OOBPrediction', 'on'); err = oobError (B); err(end)
ans = 0.053333
label = predict (B, [5.8, 2.8, 4.5, 1.4])
label =
1x1 cell array
{'versicolor'}
A regression forest predicting sepal length from the other three measurements, with the spread of its trees around each prediction.
load fisheriris rng (42); B = TreeBagger (50, meas(:,2:4), meas(:,1), 'Method', 'regression'); [yfit, sd] = predict (B, meas([1, 51, 101], 2:4))
yfit = 5.0382 6.5283 6.8350 sd = 0.1101 0.1816 0.3976
A 90% prediction interval for sepal length from the other three measurements, read off the quantiles of a regression forest.
load fisheriris
rng (42);
B = TreeBagger (100, meas(:,2:4), meas(:,1), 'Method', 'regression');
q = quantilePredict (B, meas([1, 51, 101], 2:4), ...
'Quantile', [0.05, 0.5, 0.95])
q = 4.6000 5.0463 5.5000 5.9000 6.5334 7.0853 6.2196 6.7508 7.7000
Which measurements a forest relies on: permuting a petal measurement among each tree's out-of-bag flowers raises the error the most.
load fisheriris
rng (42);
B = TreeBagger (50, meas, species, 'OOBPredictorImportance', 'on');
bar (B.OOBPermutedPredictorDeltaError);
set (gca, 'xticklabel', {'SL', 'SW', 'PL', 'PW'});
ylabel ('Rise in out-of-bag error');
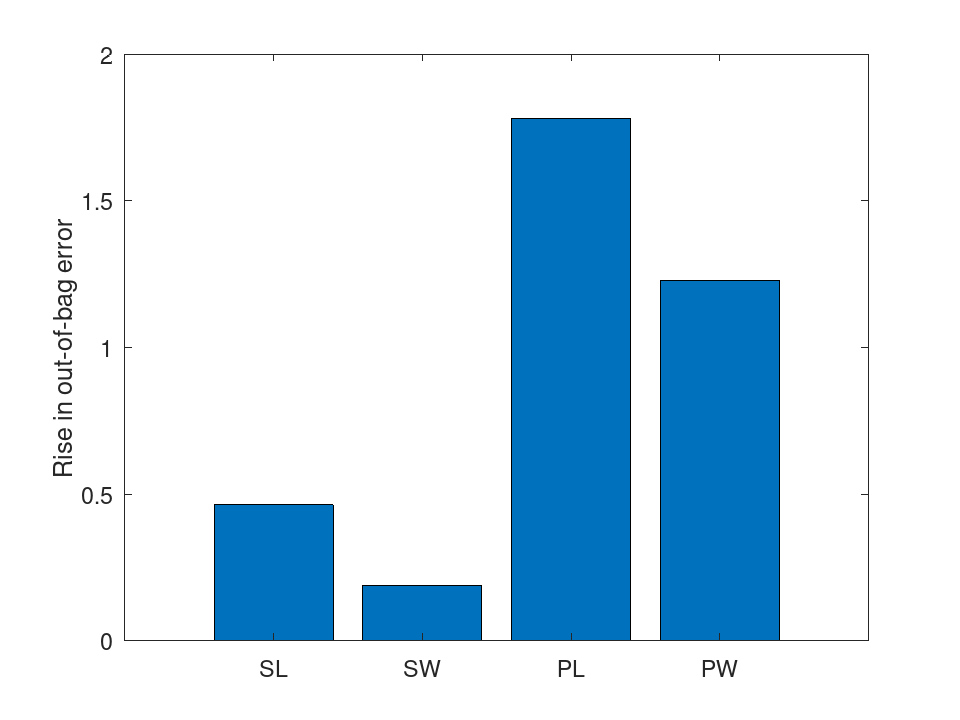
Scale the proximities of a random forest to two dimensions and draw the flowers one color per species.
load fisheriris rng (42); B = fillprox (TreeBagger (50, meas, species)); mdsprox (B, 'Colors', 'rgb');
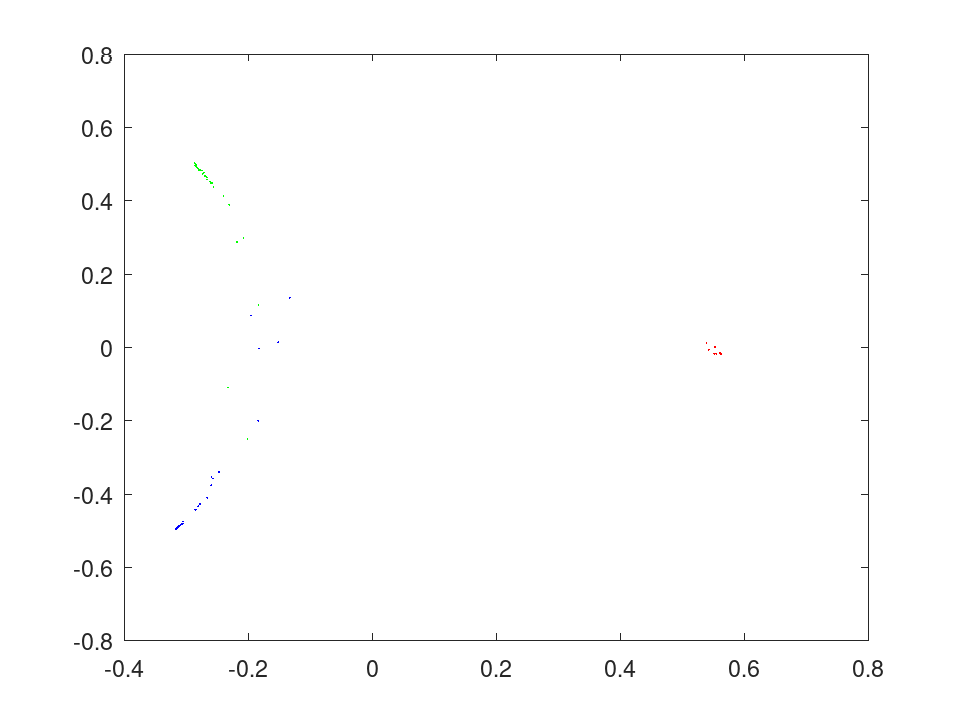
TreeBagger: C = compact (obj)
C = compact (obj) returns a
CompactTreeBagger object holding the trees and what prediction
needs. It predicts new data identically, and has no out-of-bag
methods.
See also: CompactTreeBagger, TreeBagger
Grow a random forest on the iris data, estimate its error from the observations each tree left out, and classify a new flower.
load fisheriris rng (42); B = TreeBagger (50, meas, species, 'OOBPrediction', 'on'); err = oobError (B); err(end)
ans = 0.053333
label = predict (B, [5.8, 2.8, 4.5, 1.4])
label =
1x1 cell array
{'versicolor'}
A regression forest predicting sepal length from the other three measurements, with the spread of its trees around each prediction.
load fisheriris rng (42); B = TreeBagger (50, meas(:,2:4), meas(:,1), 'Method', 'regression'); [yfit, sd] = predict (B, meas([1, 51, 101], 2:4))
yfit = 5.0382 6.5283 6.8350 sd = 0.1101 0.1816 0.3976
A 90% prediction interval for sepal length from the other three measurements, read off the quantiles of a regression forest.
load fisheriris
rng (42);
B = TreeBagger (100, meas(:,2:4), meas(:,1), 'Method', 'regression');
q = quantilePredict (B, meas([1, 51, 101], 2:4), ...
'Quantile', [0.05, 0.5, 0.95])
q = 4.6000 5.0463 5.5000 5.9000 6.5334 7.0853 6.2196 6.7508 7.7000
Which measurements a forest relies on: permuting a petal measurement among each tree's out-of-bag flowers raises the error the most.
load fisheriris
rng (42);
B = TreeBagger (50, meas, species, 'OOBPredictorImportance', 'on');
bar (B.OOBPermutedPredictorDeltaError);
set (gca, 'xticklabel', {'SL', 'SW', 'PL', 'PW'});
ylabel ('Rise in out-of-bag error');
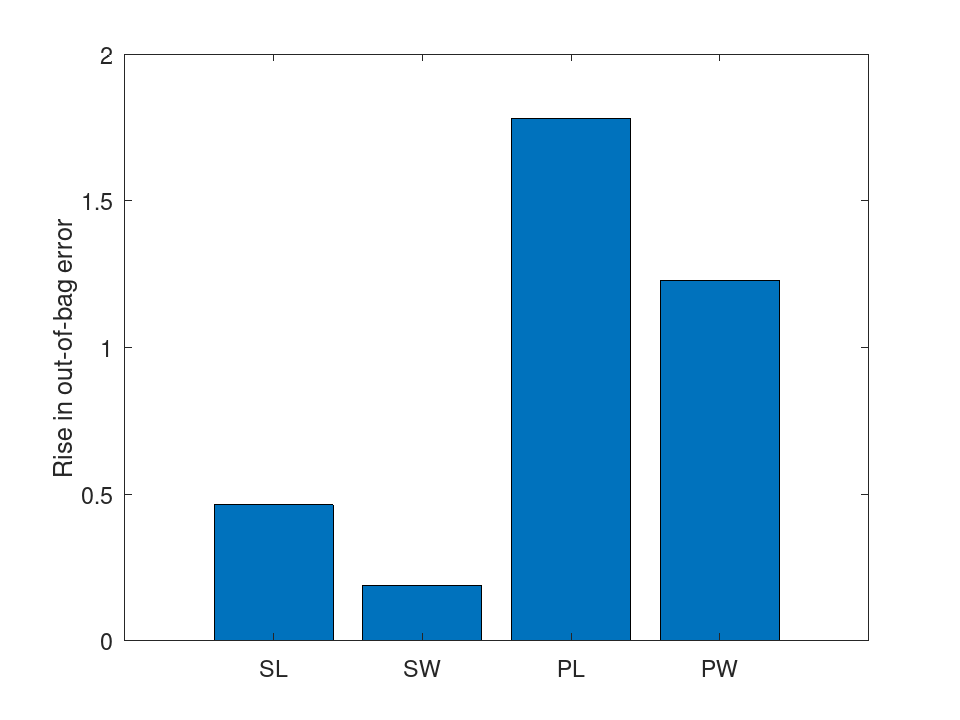
Scale the proximities of a random forest to two dimensions and draw the flowers one color per species.
load fisheriris rng (42); B = fillprox (TreeBagger (50, meas, species)); mdsprox (B, 'Colors', 'rgb');
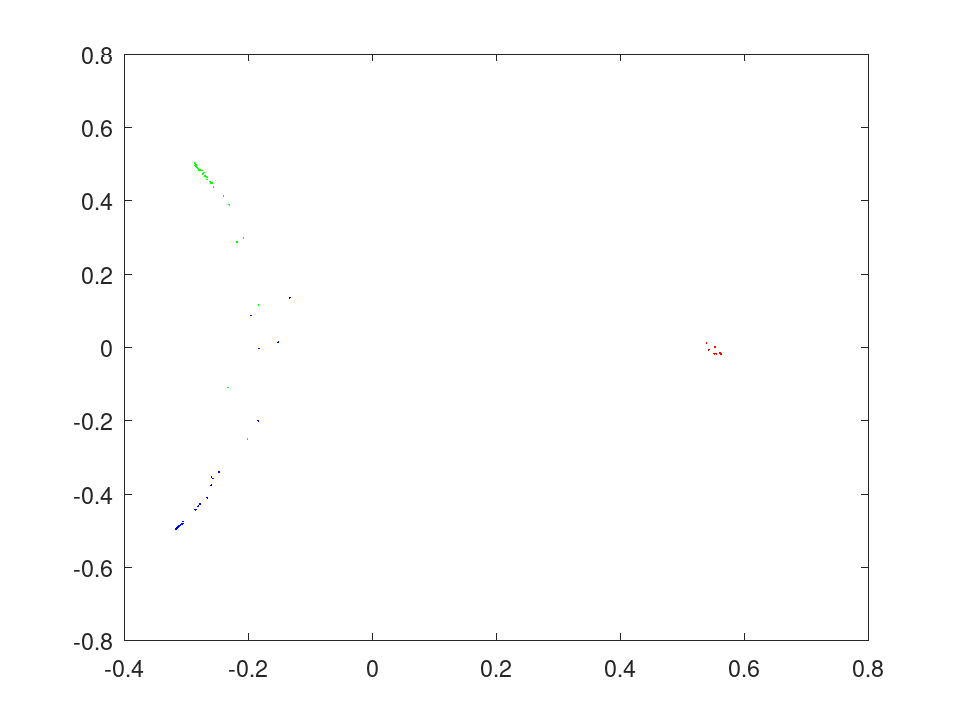
TreeBagger: B = growTrees (obj, NumTrees)
TreeBagger: B = growTrees (…, ’NumPrint’, n)
B is the ensemble with NumTrees further trees grown exactly
as the first were, their out-of-bag information added. A proximity
matrix filled by fillprox is emptied, as it no longer describes
the ensemble; MATLAB keeps it unchanged.
'NumPrint' is taken as by the TreeBagger constructor.
See also: TreeBagger, TreeBagger.append
Grow a random forest on the iris data, estimate its error from the observations each tree left out, and classify a new flower.
load fisheriris rng (42); B = TreeBagger (50, meas, species, 'OOBPrediction', 'on'); err = oobError (B); err(end)
ans = 0.053333
label = predict (B, [5.8, 2.8, 4.5, 1.4])
label =
1x1 cell array
{'versicolor'}
A regression forest predicting sepal length from the other three measurements, with the spread of its trees around each prediction.
load fisheriris rng (42); B = TreeBagger (50, meas(:,2:4), meas(:,1), 'Method', 'regression'); [yfit, sd] = predict (B, meas([1, 51, 101], 2:4))
yfit = 5.0382 6.5283 6.8350 sd = 0.1101 0.1816 0.3976
A 90% prediction interval for sepal length from the other three measurements, read off the quantiles of a regression forest.
load fisheriris
rng (42);
B = TreeBagger (100, meas(:,2:4), meas(:,1), 'Method', 'regression');
q = quantilePredict (B, meas([1, 51, 101], 2:4), ...
'Quantile', [0.05, 0.5, 0.95])
q = 4.6000 5.0463 5.5000 5.9000 6.5334 7.0853 6.2196 6.7508 7.7000
Which measurements a forest relies on: permuting a petal measurement among each tree's out-of-bag flowers raises the error the most.
load fisheriris
rng (42);
B = TreeBagger (50, meas, species, 'OOBPredictorImportance', 'on');
bar (B.OOBPermutedPredictorDeltaError);
set (gca, 'xticklabel', {'SL', 'SW', 'PL', 'PW'});
ylabel ('Rise in out-of-bag error');
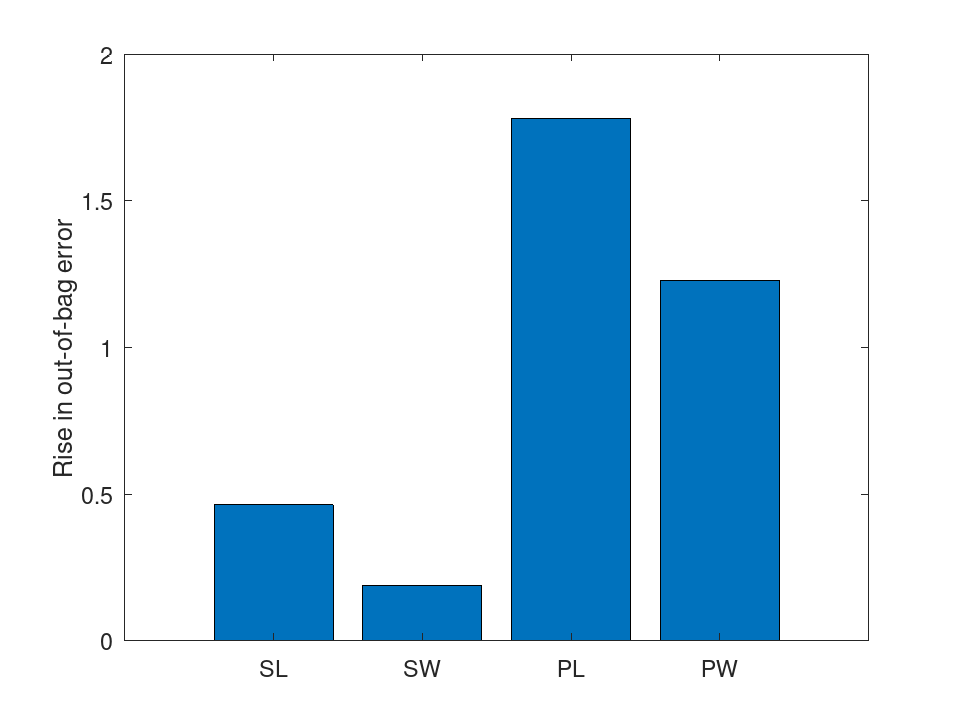
Scale the proximities of a random forest to two dimensions and draw the flowers one color per species.
load fisheriris rng (42); B = fillprox (TreeBagger (50, meas, species)); mdsprox (B, 'Colors', 'rgb');
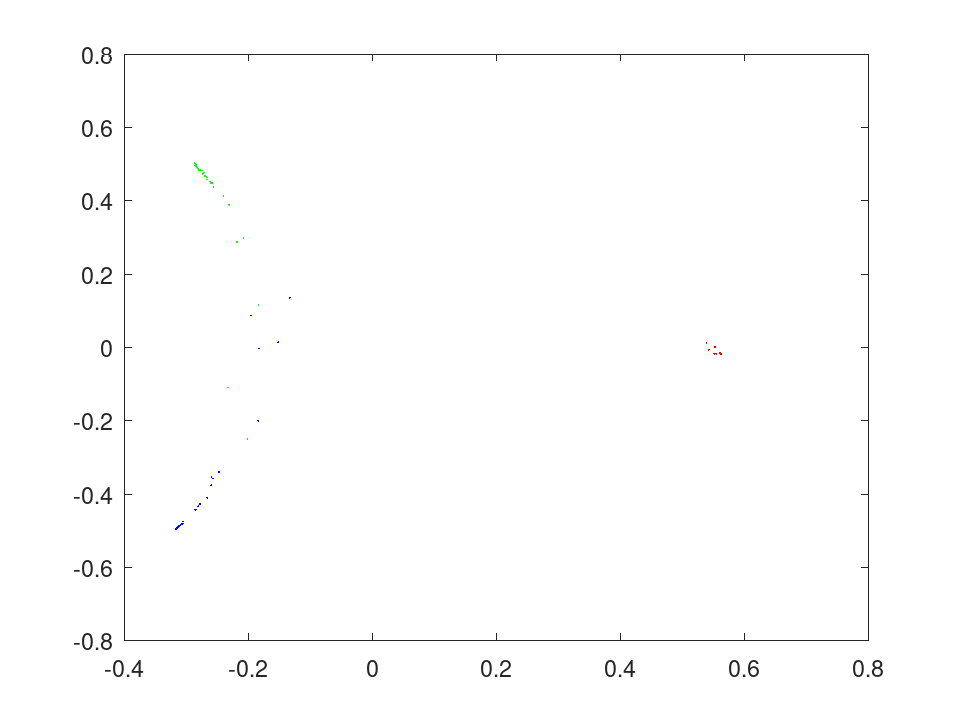
TreeBagger: B = append (B1, B2)
B is B1 with the trees of B2 appended. The two must
be of the same type, fitted on the same number of observations, with
the same classes and priors, and must agree on whether they keep
out-of-bag information and predictor importance, which are then
joined. A proximity matrix filled by fillprox is emptied.
See also: TreeBagger, TreeBagger.growTrees, CompactTreeBagger.combine
Grow a random forest on the iris data, estimate its error from the observations each tree left out, and classify a new flower.
load fisheriris rng (42); B = TreeBagger (50, meas, species, 'OOBPrediction', 'on'); err = oobError (B); err(end)
ans = 0.053333
label = predict (B, [5.8, 2.8, 4.5, 1.4])
label =
1x1 cell array
{'versicolor'}
A regression forest predicting sepal length from the other three measurements, with the spread of its trees around each prediction.
load fisheriris rng (42); B = TreeBagger (50, meas(:,2:4), meas(:,1), 'Method', 'regression'); [yfit, sd] = predict (B, meas([1, 51, 101], 2:4))
yfit = 5.0382 6.5283 6.8350 sd = 0.1101 0.1816 0.3976
A 90% prediction interval for sepal length from the other three measurements, read off the quantiles of a regression forest.
load fisheriris
rng (42);
B = TreeBagger (100, meas(:,2:4), meas(:,1), 'Method', 'regression');
q = quantilePredict (B, meas([1, 51, 101], 2:4), ...
'Quantile', [0.05, 0.5, 0.95])
q = 4.6000 5.0463 5.5000 5.9000 6.5334 7.0853 6.2196 6.7508 7.7000
Which measurements a forest relies on: permuting a petal measurement among each tree's out-of-bag flowers raises the error the most.
load fisheriris
rng (42);
B = TreeBagger (50, meas, species, 'OOBPredictorImportance', 'on');
bar (B.OOBPermutedPredictorDeltaError);
set (gca, 'xticklabel', {'SL', 'SW', 'PL', 'PW'});
ylabel ('Rise in out-of-bag error');
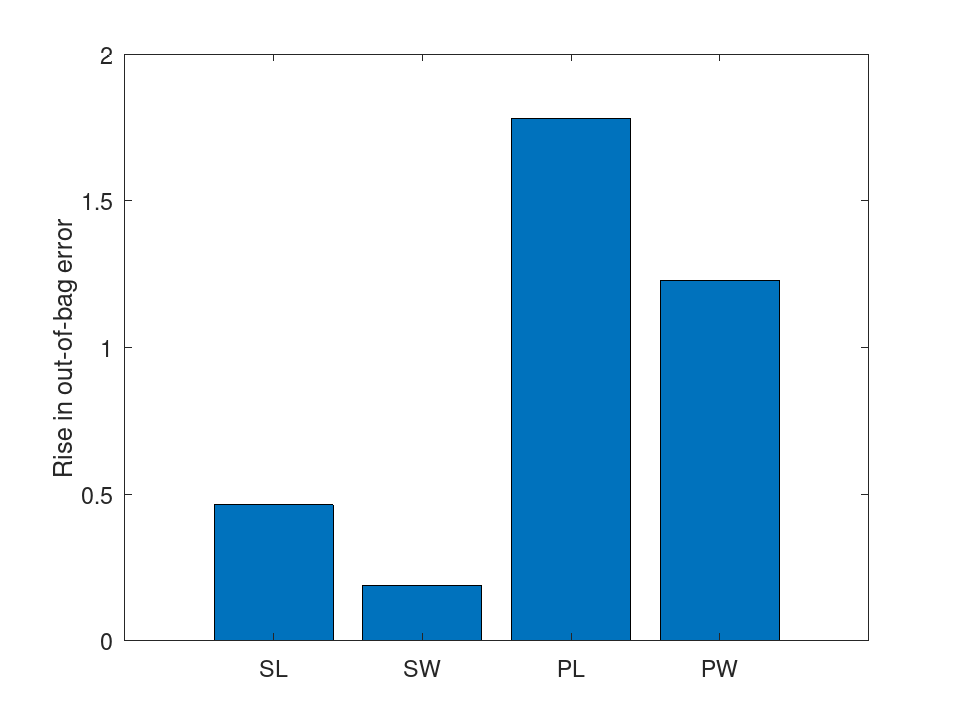
Scale the proximities of a random forest to two dimensions and draw the flowers one color per species.
load fisheriris rng (42); B = fillprox (TreeBagger (50, meas, species)); mdsprox (B, 'Colors', 'rgb');
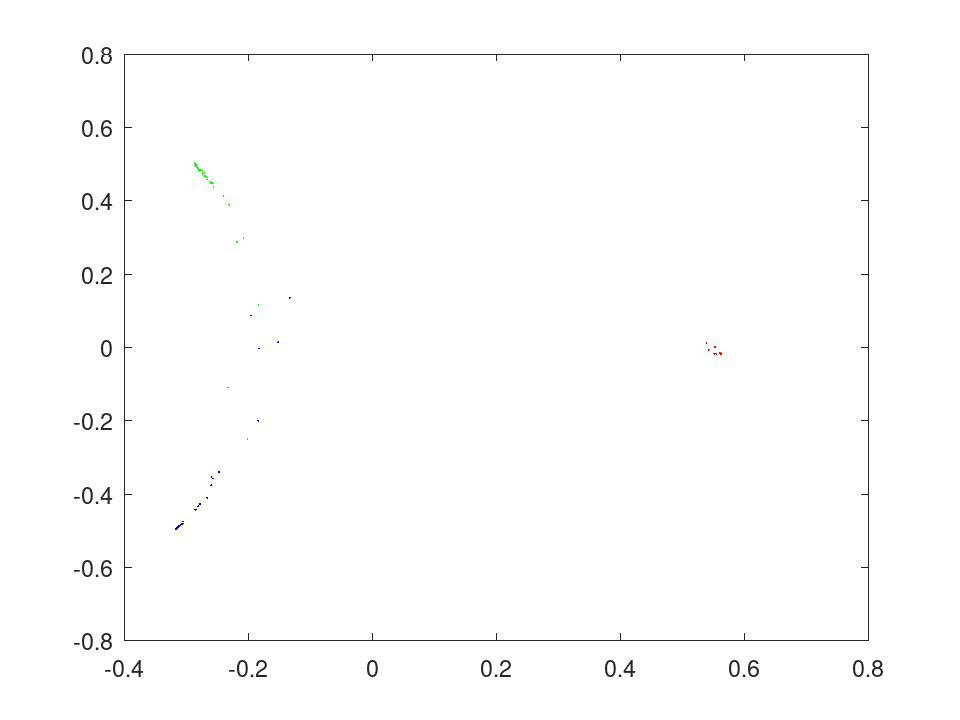
Examples
load fisheriris rng (42); B = TreeBagger (50, meas, species, 'OOBPrediction', 'on'); err = oobError (B); err(end)
ans = 0.053333
label = predict (B, [5.8, 2.8, 4.5, 1.4])
label =
1x1 cell array
{'versicolor'}
load fisheriris rng (42); B = TreeBagger (50, meas(:,2:4), meas(:,1), 'Method', 'regression'); [yfit, sd] = predict (B, meas([1, 51, 101], 2:4))
yfit = 5.0382 6.5283 6.8350 sd = 0.1101 0.1816 0.3976
load fisheriris
rng (42);
B = TreeBagger (100, meas(:,2:4), meas(:,1), 'Method', 'regression');
q = quantilePredict (B, meas([1, 51, 101], 2:4), ...
'Quantile', [0.05, 0.5, 0.95])
q = 4.6000 5.0463 5.5000 5.9000 6.5334 7.0853 6.2196 6.7508 7.7000
load fisheriris
rng (42);
B = TreeBagger (50, meas, species, 'OOBPredictorImportance', 'on');
bar (B.OOBPermutedPredictorDeltaError);
set (gca, 'xticklabel', {'SL', 'SW', 'PL', 'PW'});
ylabel ('Rise in out-of-bag error');
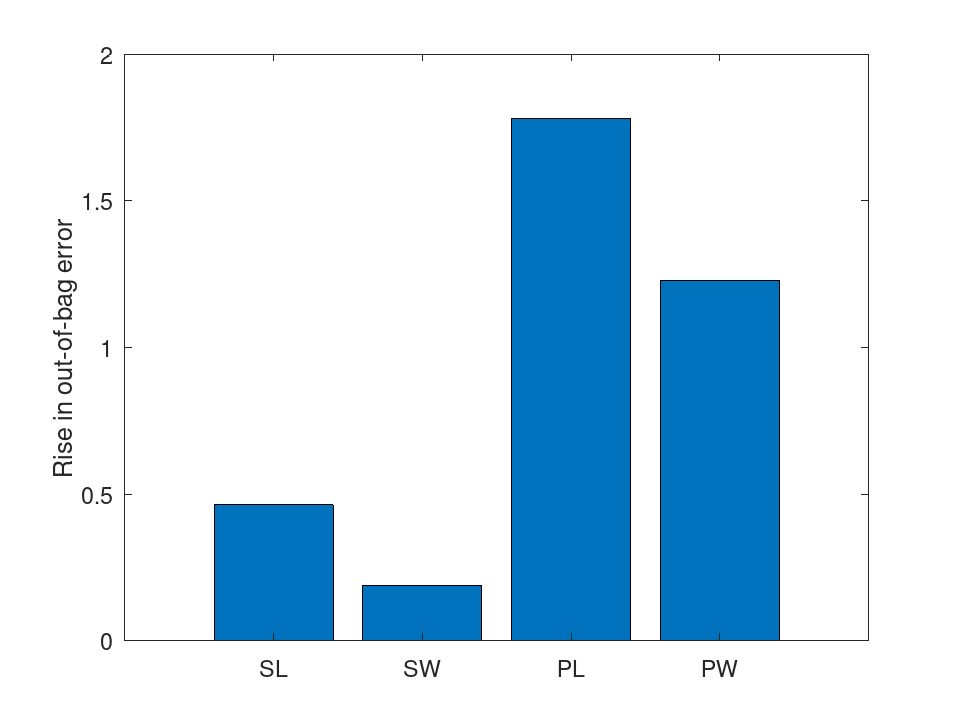
load fisheriris rng (42); B = fillprox (TreeBagger (50, meas, species)); mdsprox (B, 'Colors', 'rgb');